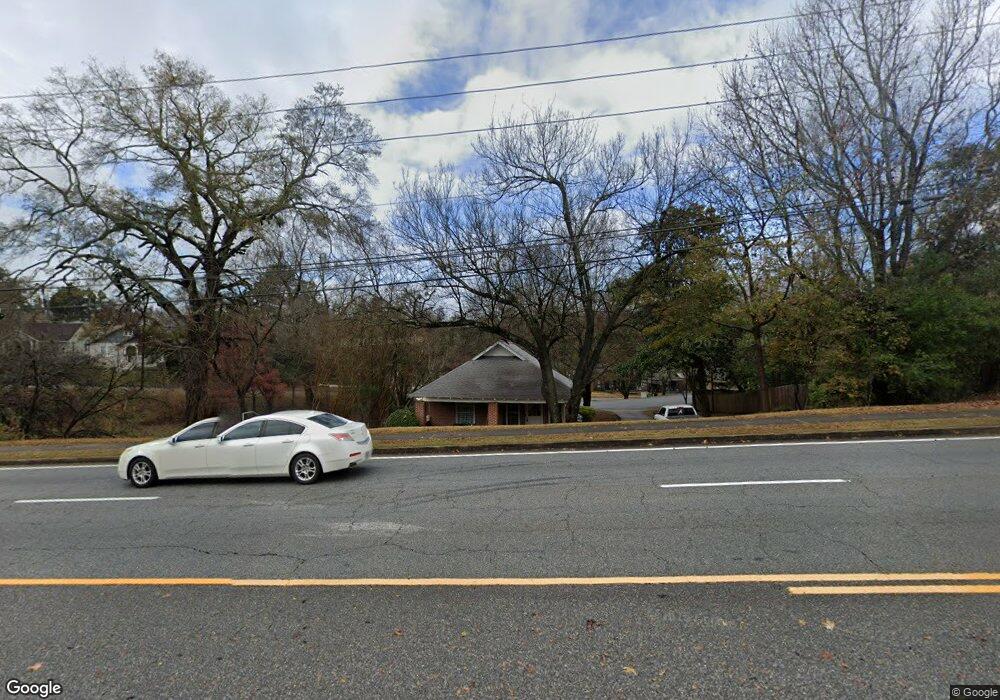
4009 2nd Ave Columbus, GA 31904
North Highlands NeighborhoodEstimated Value: $82,000 - $146,000
2
Beds
3
Baths
1,142
Sq Ft
$102/Sq Ft
Est. Value
About This Home
This home is located at 4009 2nd Ave, Columbus, GA 31904 and is currently estimated at $116,231, approximately $101 per square foot. 4009 2nd Ave is a home located in Muscogee County with nearby schools including Fox Elementary School, Double Churches Middle School, and Jordan Vocational High School.
Ownership History
Date
Name
Owned For
Owner Type
Purchase Details
Closed on
Jan 21, 2025
Sold by
Bibb City Holding Company Llc
Bought by
Third Avenue Properties Llc
Current Estimated Value
Home Financials for this Owner
Home Financials are based on the most recent Mortgage that was taken out on this home.
Original Mortgage
$112,500
Outstanding Balance
$111,723
Interest Rate
6.84%
Mortgage Type
New Conventional
Estimated Equity
$4,508
Purchase Details
Closed on
Dec 31, 2024
Sold by
Third Avenue Properties Llc
Bought by
Bibb City Holding Company Llc
Home Financials for this Owner
Home Financials are based on the most recent Mortgage that was taken out on this home.
Original Mortgage
$112,500
Outstanding Balance
$111,723
Interest Rate
6.84%
Mortgage Type
New Conventional
Estimated Equity
$4,508
Purchase Details
Closed on
Jul 10, 2024
Sold by
2Nd Avenue Animal Holdings Llc
Bought by
Third Avenue Properties Llc
Home Financials for this Owner
Home Financials are based on the most recent Mortgage that was taken out on this home.
Original Mortgage
$81,975
Interest Rate
7.03%
Mortgage Type
Construction
Purchase Details
Closed on
Jun 29, 2011
Sold by
Johnson David A
Bought by
2Nd Avenue Animal Hospital Llc
Home Financials for this Owner
Home Financials are based on the most recent Mortgage that was taken out on this home.
Original Mortgage
$45,768
Interest Rate
4.57%
Mortgage Type
New Conventional
Purchase Details
Closed on
Apr 9, 2007
Sold by
Johnson David A
Bought by
Johnson David A and Johnson Brenda P
Home Financials for this Owner
Home Financials are based on the most recent Mortgage that was taken out on this home.
Original Mortgage
$32,000
Interest Rate
6.27%
Mortgage Type
Purchase Money Mortgage
Purchase Details
Closed on
Feb 19, 2007
Sold by
Spagnoli Sandra J
Bought by
Johnson David A
Home Financials for this Owner
Home Financials are based on the most recent Mortgage that was taken out on this home.
Original Mortgage
$32,000
Interest Rate
6.27%
Mortgage Type
Purchase Money Mortgage
Create a Home Valuation Report for This Property
The Home Valuation Report is an in-depth analysis detailing your home's value as well as a comparison with similar homes in the area
Home Values in the Area
Average Home Value in this Area
Purchase History
| Date | Buyer | Sale Price | Title Company |
|---|---|---|---|
| Third Avenue Properties Llc | -- | None Listed On Document | |
| Bibb City Holding Company Llc | -- | None Listed On Document | |
| Third Avenue Properties Llc | $80,000 | None Listed On Document | |
| 2Nd Avenue Animal Hospital Llc | $55,000 | -- | |
| Johnson David A | $32,000 | None Available | |
| Johnson David A | $2,000 | None Available |
Source: Public Records
Mortgage History
| Date | Status | Borrower | Loan Amount |
|---|---|---|---|
| Open | Bibb City Holding Company Llc | $112,500 | |
| Previous Owner | Third Avenue Properties Llc | $81,975 | |
| Previous Owner | 2Nd Avenue Animal Hospital Llc | $45,768 | |
| Previous Owner | Johnson David A | $32,000 |
Source: Public Records
Tax History
| Year | Tax Paid | Tax Assessment Tax Assessment Total Assessment is a certain percentage of the fair market value that is determined by local assessors to be the total taxable value of land and additions on the property. | Land | Improvement |
|---|---|---|---|---|
| 2025 | $1,847 | $47,176 | $4,996 | $42,180 |
| 2024 | $1,003 | $25,628 | $4,996 | $20,632 |
| 2023 | $1,010 | $25,628 | $4,996 | $20,632 |
| 2022 | $609 | $14,912 | $3,496 | $11,416 |
| 2021 | $662 | $16,208 | $3,496 | $12,712 |
| 2020 | $662 | $16,208 | $3,496 | $12,712 |
| 2019 | $664 | $16,208 | $3,496 | $12,712 |
| 2018 | $664 | $16,208 | $3,496 | $12,712 |
| 2017 | $666 | $16,208 | $3,496 | $12,712 |
| 2016 | $904 | $21,917 | $2,226 | $19,691 |
| 2015 | $905 | $21,917 | $2,226 | $19,691 |
| 2014 | $906 | $21,917 | $2,226 | $19,691 |
| 2013 | -- | $8,271 | $2,226 | $6,045 |
Source: Public Records
Map
Nearby Homes
Your Personal Tour Guide
Ask me questions while you tour the home.