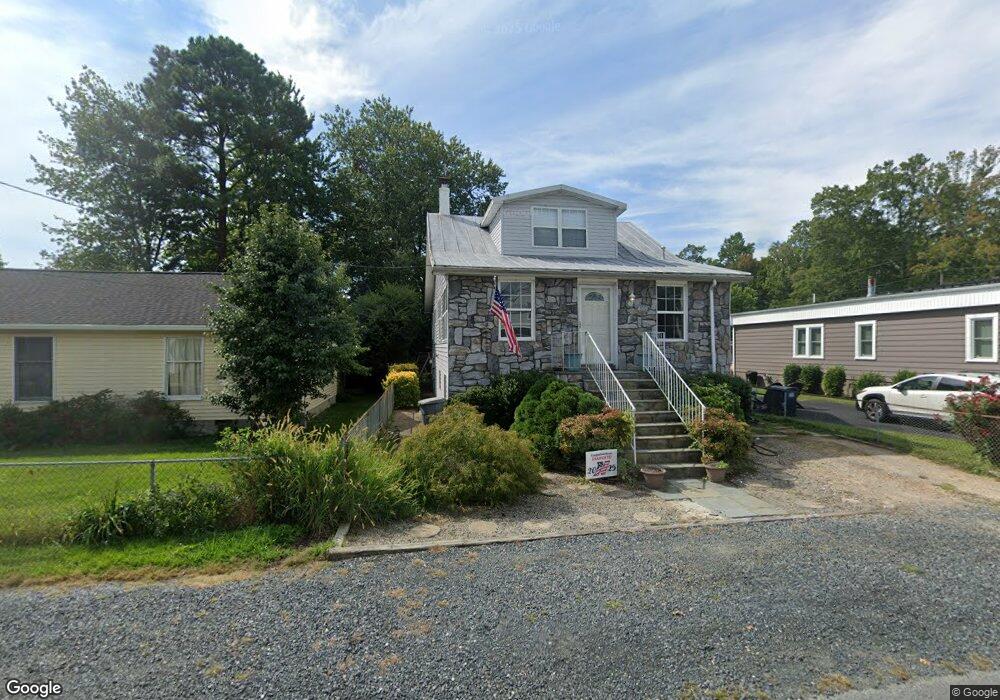
4009 2nd St North Beach, MD 20714
Estimated Value: $424,667 - $538,000
--
Bed
2
Baths
1,500
Sq Ft
$303/Sq Ft
Est. Value
About This Home
This home is located at 4009 2nd St, North Beach, MD 20714 and is currently estimated at $454,417, approximately $302 per square foot. 4009 2nd St is a home located in Calvert County with nearby schools including Windy Hill Elementary School, Windy Hill Middle School, and Northern High School.
Ownership History
Date
Name
Owned For
Owner Type
Purchase Details
Closed on
Feb 7, 2000
Sold by
Williams Bruce R
Bought by
Williams Bruce R and Williams Jennifer L
Current Estimated Value
Purchase Details
Closed on
Sep 11, 1998
Sold by
Associates Relocation Mgmt Inc
Bought by
Williams Bruce R and Taylor Jennifer L
Purchase Details
Closed on
May 27, 1994
Sold by
Dall D A
Bought by
Irvin Joel G
Home Financials for this Owner
Home Financials are based on the most recent Mortgage that was taken out on this home.
Original Mortgage
$117,850
Interest Rate
8.22%
Create a Home Valuation Report for This Property
The Home Valuation Report is an in-depth analysis detailing your home's value as well as a comparison with similar homes in the area
Home Values in the Area
Average Home Value in this Area
Purchase History
| Date | Buyer | Sale Price | Title Company |
|---|---|---|---|
| Williams Bruce R | -- | -- | |
| Williams Bruce R | $108,500 | -- | |
| Associates Relocation Mgmt Inc | $117,000 | -- | |
| Irvin Joel G | $117,900 | -- |
Source: Public Records
Mortgage History
| Date | Status | Borrower | Loan Amount |
|---|---|---|---|
| Previous Owner | Irvin Joel G | $117,850 | |
| Closed | Williams Bruce R | -- |
Source: Public Records
Tax History Compared to Growth
Tax History
| Year | Tax Paid | Tax Assessment Tax Assessment Total Assessment is a certain percentage of the fair market value that is determined by local assessors to be the total taxable value of land and additions on the property. | Land | Improvement |
|---|---|---|---|---|
| 2025 | $4,083 | $280,800 | $88,400 | $192,400 |
| 2024 | $4,083 | $265,167 | $0 | $0 |
| 2023 | $3,855 | $249,533 | $0 | $0 |
| 2022 | $3,806 | $233,900 | $88,400 | $145,500 |
| 2021 | $1,889 | $229,667 | $0 | $0 |
| 2020 | $3,811 | $225,433 | $0 | $0 |
| 2019 | $3,798 | $221,200 | $88,400 | $132,800 |
| 2018 | $3,785 | $221,200 | $88,400 | $132,800 |
| 2017 | $3,783 | $221,200 | $0 | $0 |
| 2016 | -- | $224,200 | $0 | $0 |
| 2015 | $3,874 | $224,200 | $0 | $0 |
| 2014 | $3,874 | $224,200 | $0 | $0 |
Source: Public Records
Map
Nearby Homes