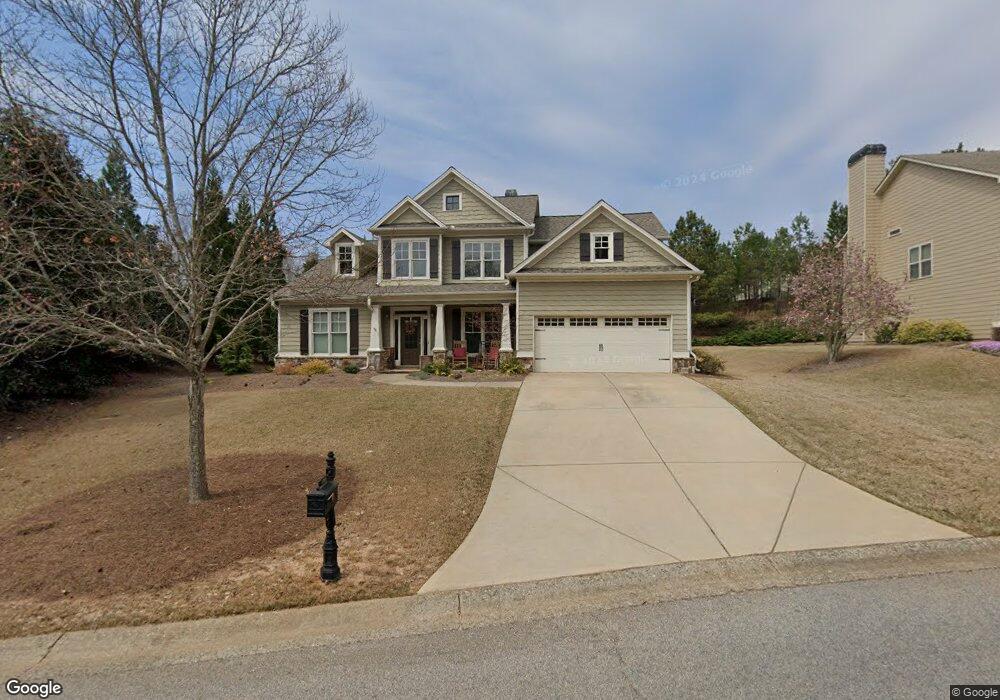
4009 Links Blvd Jefferson, GA 30549
Estimated Value: $486,809 - $562,000
4
Beds
4
Baths
3,042
Sq Ft
$171/Sq Ft
Est. Value
About This Home
This home is located at 4009 Links Blvd, Jefferson, GA 30549 and is currently estimated at $521,202, approximately $171 per square foot. 4009 Links Blvd is a home located in Jackson County with nearby schools including Gum Springs Elementary School, West Jackson Middle School, and Jackson County High School.
Ownership History
Date
Name
Owned For
Owner Type
Purchase Details
Closed on
Jun 29, 2009
Sold by
Hsbc Bank Usa National Ass
Bought by
Pentenburg Douglas J
Current Estimated Value
Home Financials for this Owner
Home Financials are based on the most recent Mortgage that was taken out on this home.
Original Mortgage
$229,700
Outstanding Balance
$145,364
Interest Rate
4.88%
Mortgage Type
New Conventional
Estimated Equity
$375,838
Purchase Details
Closed on
Feb 3, 2009
Sold by
Norris Brian T
Bought by
Hsbc Bank Usa National Associa
Purchase Details
Closed on
Jan 27, 2006
Sold by
Not Provided
Bought by
Pentenburg Douglas J
Home Financials for this Owner
Home Financials are based on the most recent Mortgage that was taken out on this home.
Original Mortgage
$225,920
Interest Rate
6.14%
Mortgage Type
New Conventional
Purchase Details
Closed on
Mar 31, 2005
Sold by
Links At Traditions
Bought by
Northstar Homes
Create a Home Valuation Report for This Property
The Home Valuation Report is an in-depth analysis detailing your home's value as well as a comparison with similar homes in the area
Home Values in the Area
Average Home Value in this Area
Purchase History
| Date | Buyer | Sale Price | Title Company |
|---|---|---|---|
| Pentenburg Douglas J | $221,000 | -- | |
| Hsbc Bank Usa National Associa | $167,900 | -- | |
| Pentenburg Douglas J | $282,400 | -- | |
| Northstar Homes | $110,000 | -- |
Source: Public Records
Mortgage History
| Date | Status | Borrower | Loan Amount |
|---|---|---|---|
| Open | Hsbc Bank Usa National Associa | $229,700 | |
| Previous Owner | Pentenburg Douglas J | $225,920 | |
| Previous Owner | Pentenburg Douglas J | $56,480 |
Source: Public Records
Tax History Compared to Growth
Tax History
| Year | Tax Paid | Tax Assessment Tax Assessment Total Assessment is a certain percentage of the fair market value that is determined by local assessors to be the total taxable value of land and additions on the property. | Land | Improvement |
|---|---|---|---|---|
| 2024 | $4,361 | $170,080 | $24,000 | $146,080 |
| 2023 | $4,361 | $154,400 | $24,000 | $130,400 |
| 2022 | $3,959 | $137,960 | $32,400 | $105,560 |
| 2021 | $3,646 | $126,360 | $20,800 | $105,560 |
| 2020 | $3,376 | $107,200 | $20,800 | $86,400 |
| 2019 | $3,427 | $107,200 | $20,800 | $86,400 |
| 2018 | $3,333 | $103,080 | $20,800 | $82,280 |
| 2017 | $3,149 | $96,694 | $20,800 | $75,894 |
| 2016 | $3,166 | $96,694 | $20,800 | $75,894 |
| 2015 | $2,668 | $81,894 | $6,000 | $75,894 |
| 2014 | $2,409 | $74,004 | $6,000 | $68,004 |
| 2013 | -- | $74,003 | $6,000 | $68,003 |
Source: Public Records
Map
Nearby Homes
- 4016 Links Blvd
- 4380 Links Blvd
- 4022 Links Blvd
- 2227 Cotton Gin Row
- 4040 Links Blvd
- 4341 Links Blvd
- The Wynward Plan at Traditions of Braselton
- The Grayson Plan at Traditions of Braselton
- The Brookmont Plan at Traditions of Braselton
- The Rosewood Plan at Traditions of Braselton
- 4045 Links Blvd
- 4057 Links Blvd
- 4306 Links Blvd
- 4300 Links Blvd
- 3330 Shady Creek Ct
- 2372 Cotton Gin Row
- 2345 Cotton Gin Row
- 4248 Links Blvd
- 4502 Links Blvd
- 4015 Links Blvd
- 0000 Cotton Gin Row Unit Athens
- LOT 7 Cotton Gin Row
- 0 Cotton Gin Row Unit 8615607
- 0 Cotton Gin Row Unit 8584653
- 0 Cotton Gin Row Unit 8707376
- 0 Cotton Gin Row Unit 8683754
- 0 Cotton Gin Row Unit 8741762
- 0 Cotton Gin Row Unit 8755285
- 0 Cotton Gin Row Unit 8756111
- 0 Cotton Gin Row Unit 8759918
- 0 Cotton Gin Row Unit 8780053
- 0 Cotton Gin Row Unit 8795001
- 0 Cotton Gin Row Unit 8805327
- 0 Cotton Gin Row Unit 8805214
- 0 Cotton Gin Row Unit 8812436
- 0 Cotton Gin Row Unit 8384052
- 0 Cotton Gin Row Unit 8387328
- 0 Cotton Gin Row Unit 8472986
- 0 Cotton Gin Row Unit 8869223