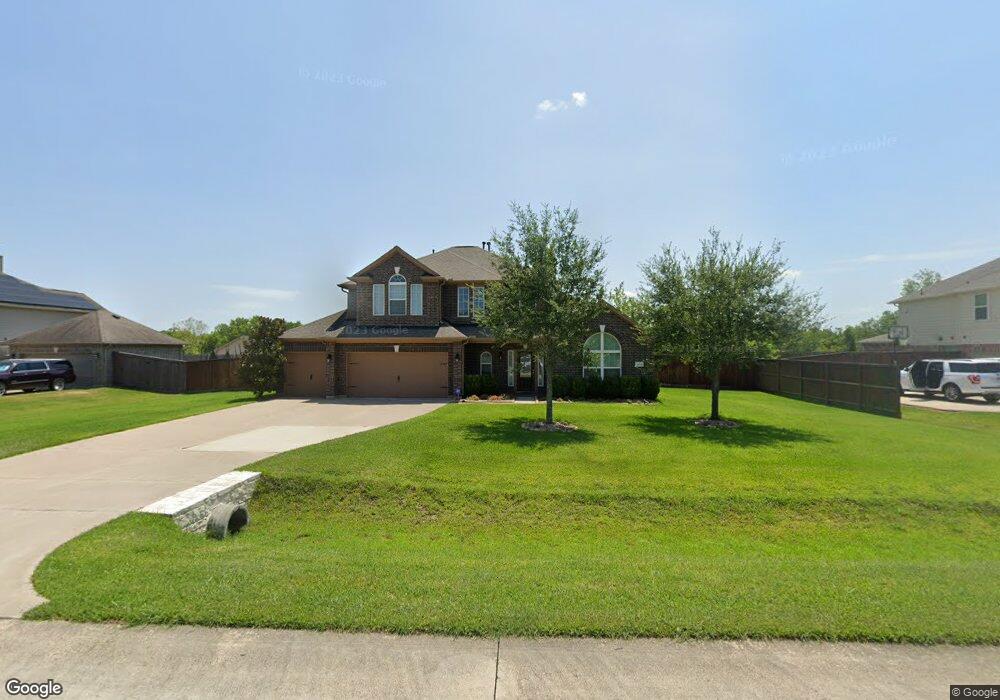
4009 Moray Dr Pearland, TX 77584
Estimated Value: $517,000 - $553,000
4
Beds
4
Baths
3,304
Sq Ft
$162/Sq Ft
Est. Value
About This Home
This home is located at 4009 Moray Dr, Pearland, TX 77584 and is currently estimated at $535,681, approximately $162 per square foot. 4009 Moray Dr is a home located in Brazoria County with nearby schools including Massey Ranch Elementary School, Pearland Junior High School South, and Sam Jamison Middle School.
Ownership History
Date
Name
Owned For
Owner Type
Purchase Details
Closed on
Mar 20, 2017
Sold by
Beaupre Chris and Beaupre Angela
Bought by
Thompson Michael L
Current Estimated Value
Home Financials for this Owner
Home Financials are based on the most recent Mortgage that was taken out on this home.
Original Mortgage
$352,000
Outstanding Balance
$179,806
Interest Rate
4.19%
Mortgage Type
New Conventional
Estimated Equity
$355,875
Purchase Details
Closed on
Sep 18, 2015
Sold by
Castlerock Communities Lp
Bought by
Beaupre Christopher James and Beaupre Angela Annette
Home Financials for this Owner
Home Financials are based on the most recent Mortgage that was taken out on this home.
Original Mortgage
$42,022
Interest Rate
3.99%
Mortgage Type
Stand Alone Second
Create a Home Valuation Report for This Property
The Home Valuation Report is an in-depth analysis detailing your home's value as well as a comparison with similar homes in the area
Home Values in the Area
Average Home Value in this Area
Purchase History
| Date | Buyer | Sale Price | Title Company |
|---|---|---|---|
| Thompson Michael L | -- | None Available | |
| Thompson Michael L | -- | None Available | |
| Beaupre Christopher James | -- | Crown Title Co Houston |
Source: Public Records
Mortgage History
| Date | Status | Borrower | Loan Amount |
|---|---|---|---|
| Open | Thompson Michael L | $352,000 | |
| Closed | Thompson Michael L | $352,000 | |
| Previous Owner | Beaupre Christopher James | $42,022 |
Source: Public Records
Tax History Compared to Growth
Tax History
| Year | Tax Paid | Tax Assessment Tax Assessment Total Assessment is a certain percentage of the fair market value that is determined by local assessors to be the total taxable value of land and additions on the property. | Land | Improvement |
|---|---|---|---|---|
| 2025 | $9,367 | $539,110 | $44,110 | $495,000 |
| 2023 | $9,367 | $457,392 | $44,110 | $472,774 |
| 2022 | $10,003 | $415,811 | $36,750 | $423,820 |
| 2021 | $9,739 | $378,010 | $32,340 | $345,670 |
| 2020 | $10,295 | $381,580 | $32,340 | $349,240 |
| 2019 | $10,462 | $387,660 | $32,340 | $355,320 |
| 2018 | $10,822 | $402,770 | $32,340 | $370,430 |
| 2017 | $8,718 | $322,870 | $32,340 | $290,530 |
| 2016 | $8,718 | $322,870 | $32,340 | $290,530 |
| 2015 | $558 | $196,370 | $22,050 | $174,320 |
| 2014 | $558 | $26,950 | $26,950 | $0 |
Source: Public Records
Map
Nearby Homes
- 3524 Charles Ave
- 3525 Charles Ave
- 00 Bailey Rd
- 4722 Kathy Dr
- 4227 Old Chocolate Bayou Rd
- 0 Bailey Rd Unit 89982715
- 3615 Rivers Rd
- 4146 S Webber Dr
- 4139 County Road 101
- 0 Bailey Rd Masters Rd Unit 38179222
- 7110 W Mockingbird Ln
- 3901 Magnolia Pkwy
- 3638 Manvel Rd
- 4311 Duesenberg Ct
- 18685 Tree Top Ln
- 18660 Tree Top Ln
- 3310 E Overdale Dr
- 2826 Foxden Dr
- 4101 Fm 1128 Rd
- 3818 Wingtail Way
- 4011 Moray Dr
- 4007 Moray Dr
- 4011 Moray Dr
- 8001 Cullen Estates Dr
- 8001 Cullen Park Dr
- 4008 Moray Dr
- 4005 Moray Dr
- 4013 Moray Dr
- 4010 Moray Dr
- LT9BLK2 Cullen Estates Dr
- LT18BLK2 Cullen Estates Dr
- LT16BLK2 Cullen Estates Dr
- LT17BLK2 Cullen Estates Dr
- LT19BLK2 Cullen Estates Dr
- LT20BLK2 Cullen Estates Dr
- LT3BLK1 Cullen Estates Dr
- LT21BLK2 Cullen Estates Dr
- LT4BLK1 Cullen Estates Dr
- LT22BLK2 Cullen Estates Dr
- LT8BLK1 Cullen Estates Dr