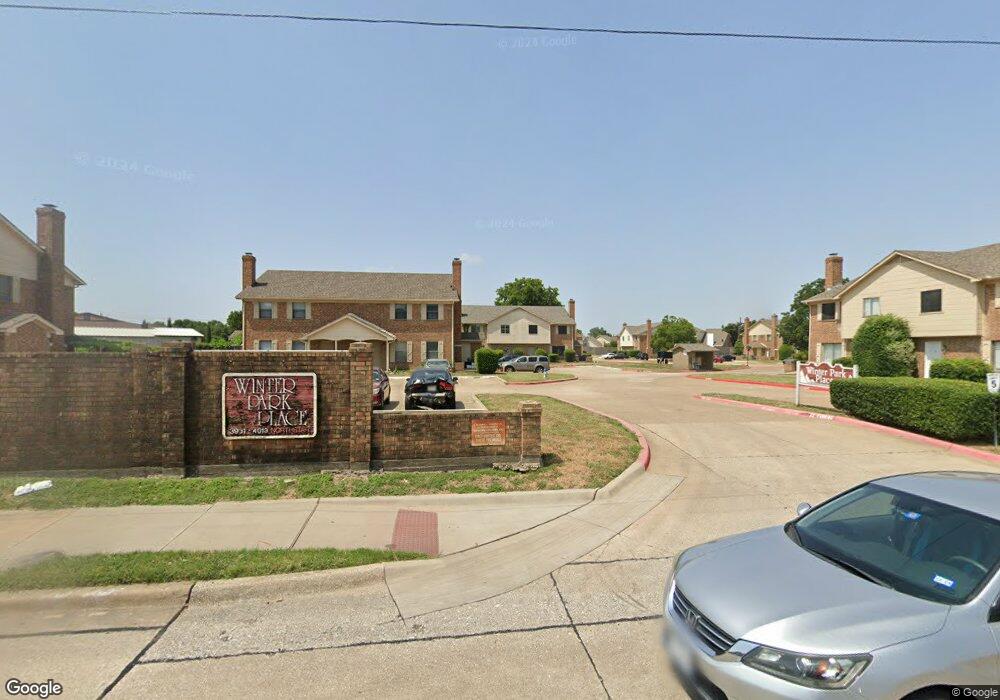
4009 N Garland Ave Unit 2K Garland, TX 75040
Holiday Park NeighborhoodEstimated Value: $174,000 - $179,000
2
Beds
1
Bath
1,017
Sq Ft
$174/Sq Ft
Est. Value
About This Home
This home is located at 4009 N Garland Ave Unit 2K, Garland, TX 75040 and is currently estimated at $176,553, approximately $173 per square foot. 4009 N Garland Ave Unit 2K is a home located in Dallas County with nearby schools including International Leadership of Texas - Garland K-8 (Elementary School), International Leadership of Texas - Garland K-8 (Middle School), and Garland Can Academy.
Ownership History
Date
Name
Owned For
Owner Type
Purchase Details
Closed on
Oct 28, 2016
Sold by
Nguyen Nga Thi
Bought by
Chau Phue Hoan and Vo Hoang Thi
Current Estimated Value
Purchase Details
Closed on
Sep 4, 2014
Sold by
Ly Tong
Bought by
Nguyen Nga Thi
Purchase Details
Closed on
Dec 21, 2009
Sold by
Hoang Vu
Bought by
Ly Tong
Purchase Details
Closed on
Oct 31, 2009
Sold by
Huynh Susan
Bought by
Hoang Vu
Purchase Details
Closed on
Aug 15, 2009
Sold by
Huynh Susan
Bought by
Huynh Dung Quoc Dao
Purchase Details
Closed on
Sep 25, 2006
Sold by
Lam Tong Thanh
Bought by
Huynh Susan
Home Financials for this Owner
Home Financials are based on the most recent Mortgage that was taken out on this home.
Original Mortgage
$49,500
Interest Rate
6.51%
Mortgage Type
Purchase Money Mortgage
Create a Home Valuation Report for This Property
The Home Valuation Report is an in-depth analysis detailing your home's value as well as a comparison with similar homes in the area
Home Values in the Area
Average Home Value in this Area
Purchase History
| Date | Buyer | Sale Price | Title Company |
|---|---|---|---|
| Chau Phue Hoan | -- | None Available | |
| Nguyen Nga Thi | -- | None Available | |
| Ly Tong | -- | None Available | |
| Hoang Vu | -- | None Available | |
| Huynh Dung Quoc Dao | -- | None Available | |
| Huynh Susan | -- | Rtt |
Source: Public Records
Mortgage History
| Date | Status | Borrower | Loan Amount |
|---|---|---|---|
| Previous Owner | Huynh Susan | $49,500 |
Source: Public Records
Tax History Compared to Growth
Tax History
| Year | Tax Paid | Tax Assessment Tax Assessment Total Assessment is a certain percentage of the fair market value that is determined by local assessors to be the total taxable value of land and additions on the property. | Land | Improvement |
|---|---|---|---|---|
| 2025 | $1,029 | $170,200 | $49,620 | $120,580 |
| 2024 | $1,029 | $170,200 | $49,620 | $120,580 |
| 2023 | $1,029 | $122,040 | $16,540 | $105,500 |
| 2022 | $3,001 | $122,040 | $16,540 | $105,500 |
| 2021 | $3,209 | $122,040 | $7,440 | $114,600 |
| 2020 | $3,253 | $122,040 | $7,440 | $114,600 |
| 2019 | $1,721 | $61,020 | $6,620 | $54,400 |
| 2018 | $1,722 | $61,020 | $6,620 | $54,400 |
| 2017 | $430 | $61,020 | $6,620 | $54,400 |
| 2016 | $1,653 | $58,640 | $6,620 | $52,020 |
| 2015 | $1,106 | $58,640 | $6,620 | $52,020 |
| 2014 | $1,106 | $53,390 | $6,620 | $46,770 |
Source: Public Records
Map
Nearby Homes
- 3931 N Garland Ave Unit 4
- 3931 N Garland Ave Unit 1
- 4013 N Garland Ave Unit 3
- 3947 N Garland Ave Unit 2
- 3947 N Garland Ave Unit 1
- 3900 N Garland Ave
- 3910 Brandon Park Dr
- 3931 Pickett Place
- 2113 Vail Dr
- 4210 Stonecastle Dr
- 1808 Greenspring Cir
- 2014 Powderhorn Dr
- 1914 Snowmass Ln
- 1822 Highbrook Ct
- 1814 Highbrook Ct
- 2301 Angel Fire Dr
- 4221 N Garland Ave Unit lot 1
- 2305 Matterhorn Dr
- 2329 Jamaica Place
- 2329 Knighthood Ln
- 4009 N Garland Ave Unit 1K
- 4009 N Garland Ave Unit 4
- 4009 N Garland Ave Unit 3K
- 4009 N Garland Ave Unit 3
- 4009 N Garland Ave Unit 1
- 4009 N Garland Ave Unit 3
- 4013 N Garland Ave Unit 4
- 4013 N Garland Ave Unit 3L
- 4013 N Garland Ave Unit 2L
- 4013 N Garland Ave Unit 1L
- 4013 N Garland Ave Unit 1-4
- 4005 N Garland Ave Unit 1J
- 4005 N Garland Ave Unit 4
- 4005 N Garland Ave Unit 3J
- 4005 N Garland Ave Unit 2J
- 4005 N Garland Ave Unit 2
- 4005 N Garland Ave Unit 3
- 3939 N Garland Ave Unit 4
- 3939 N Garland Ave Unit 3C
- 3939 N Garland Ave Unit 2C