


401 10th St Huntington, WV 25701
Downtown Huntington NeighborhoodEstimated payment $1,385/month
Total Views
22,886
1
Bed
1
Bath
906
Sq Ft
$182
Price per Sq Ft
Highlights
- Sauna
- Deck
- Tile Flooring
- 0.2 Acre Lot
- Brick or Stone Mason
- 4-minute walk to Harris Riverfront Park
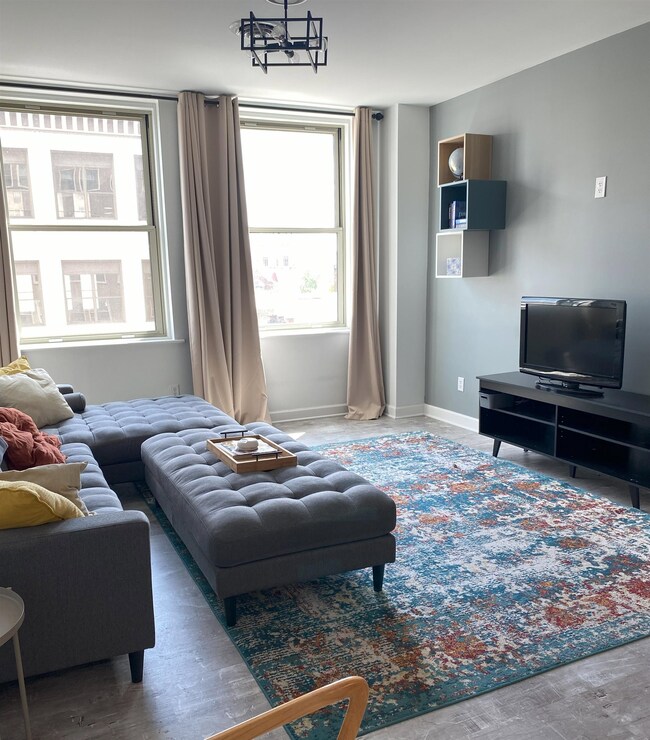
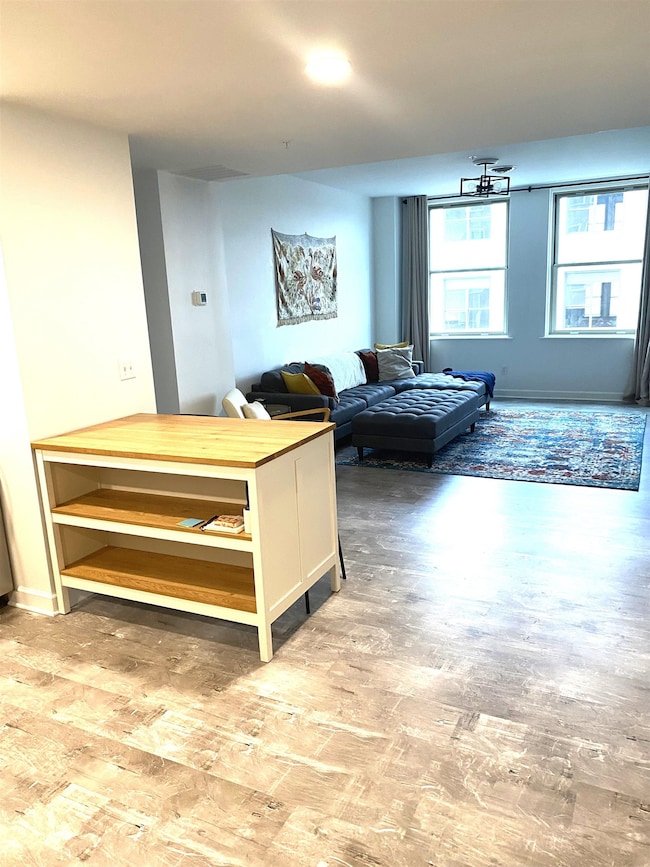
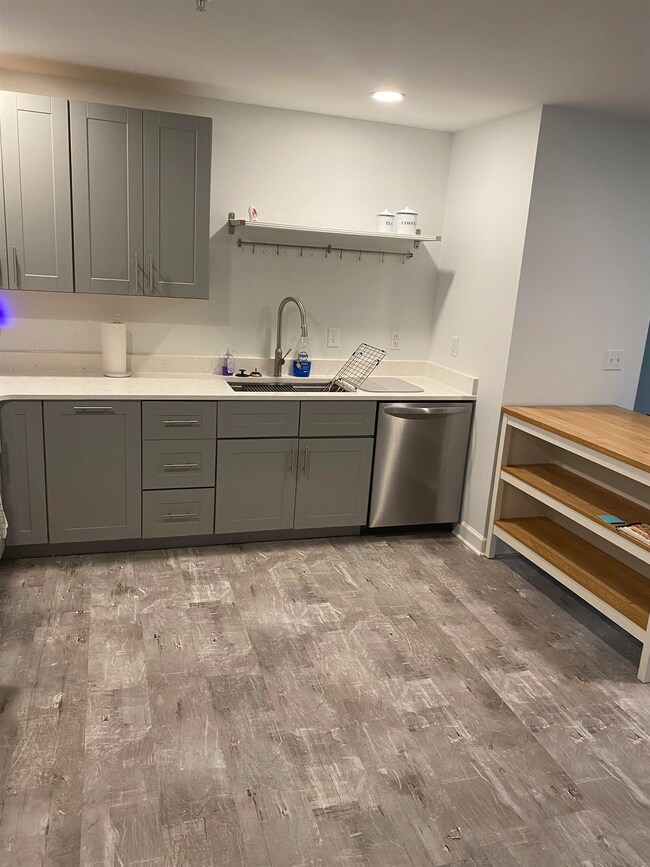
About This Home
This very nice condo on the 4th floor in The St James building in downtown Huntington, has been finished within the past 2-3 years, with new windows, plumbing, electric, bathroom, kitchen with appliances, HVAC, washer & dryer, bedroom plus additional room for office, den or currently used as extra bedroom; etc. Nice pantry, laundry and storage. There has been no smoking and no pets.
Property Details
Home Type
- Condominium
Est. Annual Taxes
- $1,291
Year Built
- Built in 1920
HOA Fees
- $365 Monthly HOA Fees
Parking
- On-Street Parking
Home Design
- Brick or Stone Mason
- Rubber Roof
Interior Spaces
- 906 Sq Ft Home
- 1-Story Property
- Sauna
Kitchen
- Oven or Range
- Microwave
- Dishwasher
Flooring
- Laminate
- Tile
Bedrooms and Bathrooms
- 1 Bedroom
- 1 Full Bathroom
Laundry
- Dryer
- Washer
Home Security
Outdoor Features
- Deck
Utilities
- Central Heating and Cooling System
- Electric Water Heater
- Cable TV Available
Community Details
- Fire and Smoke Detector
Listing and Financial Details
- Assessor Parcel Number 270.79
Map
Create a Home Valuation Report for This Property
The Home Valuation Report is an in-depth analysis detailing your home's value as well as a comparison with similar homes in the area
Home Values in the Area
Average Home Value in this Area
Tax History
| Year | Tax Paid | Tax Assessment Tax Assessment Total Assessment is a certain percentage of the fair market value that is determined by local assessors to be the total taxable value of land and additions on the property. | Land | Improvement |
|---|---|---|---|---|
| 2024 | $1,291 | $96,420 | $5,700 | $90,720 |
| 2023 | $1,294 | $96,420 | $5,700 | $90,720 |
| 2022 | $1,301 | $96,420 | $5,700 | $90,720 |
| 2021 | $1,308 | $96,420 | $5,700 | $90,720 |
| 2020 | $1,262 | $96,420 | $5,700 | $90,720 |
| 2019 | $1,292 | $96,420 | $5,700 | $90,720 |
| 2018 | $1,295 | $96,420 | $5,700 | $90,720 |
| 2017 | $1,296 | $96,420 | $5,700 | $90,720 |
| 2016 | $1,267 | $94,800 | $4,080 | $90,720 |
| 2015 | $1,264 | $94,800 | $4,080 | $90,720 |
| 2014 | $1,266 | $94,800 | $4,080 | $90,720 |
Source: Public Records
Property History
| Date | Event | Price | Change | Sq Ft Price |
|---|---|---|---|---|
| 07/07/2025 07/07/25 | Pending | -- | -- | -- |
| 07/03/2025 07/03/25 | Pending | -- | -- | -- |
| 06/04/2025 06/04/25 | For Sale | $275,000 | +66.7% | $147 / Sq Ft |
| 04/30/2025 04/30/25 | For Sale | $165,000 | +1.5% | $182 / Sq Ft |
| 05/22/2024 05/22/24 | Sold | $162,500 | -9.2% | $166 / Sq Ft |
| 04/17/2024 04/17/24 | Pending | -- | -- | -- |
| 04/05/2024 04/05/24 | Price Changed | $178,900 | -5.8% | $183 / Sq Ft |
| 03/11/2024 03/11/24 | For Sale | $189,900 | +5.5% | $194 / Sq Ft |
| 03/08/2024 03/08/24 | Sold | $180,000 | -2.7% | $184 / Sq Ft |
| 07/03/2023 07/03/23 | Pending | -- | -- | -- |
| 06/06/2023 06/06/23 | For Sale | $185,000 | +1.9% | $189 / Sq Ft |
| 04/17/2023 04/17/23 | Pending | -- | -- | -- |
| 02/10/2023 02/10/23 | Sold | $181,500 | -4.4% | $166 / Sq Ft |
| 01/30/2023 01/30/23 | Pending | -- | -- | -- |
| 01/18/2023 01/18/23 | For Sale | $189,900 | +2.6% | $173 / Sq Ft |
| 01/09/2023 01/09/23 | For Sale | $185,000 | +46.8% | $189 / Sq Ft |
| 12/29/2022 12/29/22 | Pending | -- | -- | -- |
| 11/30/2022 11/30/22 | Sold | $126,000 | -33.6% | $171 / Sq Ft |
| 10/13/2022 10/13/22 | For Sale | $189,900 | +43.9% | $173 / Sq Ft |
| 10/07/2022 10/07/22 | Sold | $132,000 | -5.6% | $149 / Sq Ft |
| 09/21/2022 09/21/22 | Pending | -- | -- | -- |
| 09/21/2022 09/21/22 | For Sale | $139,900 | 0.0% | $158 / Sq Ft |
| 09/19/2022 09/19/22 | Pending | -- | -- | -- |
| 09/14/2022 09/14/22 | Pending | -- | -- | -- |
| 06/28/2022 06/28/22 | For Sale | $139,900 | +24.4% | $158 / Sq Ft |
| 06/01/2022 06/01/22 | Pending | -- | -- | -- |
| 05/26/2022 05/26/22 | Sold | $112,500 | +18.4% | $127 / Sq Ft |
| 05/13/2022 05/13/22 | Sold | $95,000 | 0.0% | $107 / Sq Ft |
| 04/04/2022 04/04/22 | Pending | -- | -- | -- |
| 03/29/2022 03/29/22 | Pending | -- | -- | -- |
| 03/22/2022 03/22/22 | Sold | $95,000 | -32.1% | $140 / Sq Ft |
| 03/21/2022 03/21/22 | For Sale | $139,900 | +47.3% | $158 / Sq Ft |
| 03/18/2022 03/18/22 | Off Market | $95,000 | -- | -- |
| 03/04/2022 03/04/22 | For Sale | $109,900 | +214.0% | $124 / Sq Ft |
| 03/01/2022 03/01/22 | Pending | -- | -- | -- |
| 02/25/2022 02/25/22 | Pending | -- | -- | -- |
| 02/23/2022 02/23/22 | Sold | $35,000 | -68.2% | $39 / Sq Ft |
| 02/21/2022 02/21/22 | Price Changed | $109,900 | +4.7% | $124 / Sq Ft |
| 02/14/2022 02/14/22 | For Sale | $105,000 | 0.0% | $154 / Sq Ft |
| 02/14/2022 02/14/22 | Price Changed | $105,000 | +10.5% | $154 / Sq Ft |
| 02/14/2022 02/14/22 | Off Market | $95,000 | -- | -- |
| 02/11/2022 02/11/22 | Price Changed | $135,000 | +15.4% | $183 / Sq Ft |
| 02/08/2022 02/08/22 | Pending | -- | -- | -- |
| 01/10/2022 01/10/22 | Price Changed | $117,000 | -19.3% | $132 / Sq Ft |
| 12/09/2021 12/09/21 | For Sale | $145,000 | 0.0% | $197 / Sq Ft |
| 11/01/2021 11/01/21 | Rented | $1,250 | 0.0% | -- |
| 09/20/2021 09/20/21 | Price Changed | $110,000 | 0.0% | $162 / Sq Ft |
| 09/16/2021 09/16/21 | For Sale | $110,000 | -5.1% | $124 / Sq Ft |
| 08/17/2021 08/17/21 | For Sale | $115,900 | +78.3% | $170 / Sq Ft |
| 07/14/2021 07/14/21 | For Sale | $65,000 | 0.0% | $72 / Sq Ft |
| 05/26/2021 05/26/21 | For Rent | $1,400 | 0.0% | -- |
| 04/09/2021 04/09/21 | For Sale | $120,000 | -47.8% | $136 / Sq Ft |
| 04/01/2021 04/01/21 | Sold | $230,000 | -4.1% | $170 / Sq Ft |
| 11/04/2020 11/04/20 | For Sale | $239,900 | +124.2% | $177 / Sq Ft |
| 07/17/2020 07/17/20 | Sold | $107,000 | -23.6% | $156 / Sq Ft |
| 06/26/2020 06/26/20 | Sold | $140,000 | +300.0% | $128 / Sq Ft |
| 06/24/2020 06/24/20 | Off Market | $35,000 | -- | -- |
| 06/16/2020 06/16/20 | Pending | -- | -- | -- |
| 05/28/2020 05/28/20 | Price Changed | $117,000 | -24.5% | $170 / Sq Ft |
| 05/07/2020 05/07/20 | Pending | -- | -- | -- |
| 04/24/2020 04/24/20 | Price Changed | $155,000 | -3.1% | $142 / Sq Ft |
| 03/24/2020 03/24/20 | Price Changed | $160,000 | +33.3% | $146 / Sq Ft |
| 03/18/2020 03/18/20 | For Sale | $120,000 | +84.6% | $174 / Sq Ft |
| 01/07/2020 01/07/20 | For Sale | $65,000 | +85.7% | $72 / Sq Ft |
| 12/07/2019 12/07/19 | Off Market | $35,000 | -- | -- |
| 10/21/2019 10/21/19 | For Sale | $165,000 | +84.4% | $151 / Sq Ft |
| 08/02/2019 08/02/19 | Sold | $89,500 | +37.7% | $131 / Sq Ft |
| 06/20/2019 06/20/19 | Pending | -- | -- | -- |
| 03/15/2019 03/15/19 | For Sale | $65,000 | -64.9% | $72 / Sq Ft |
| 10/19/2018 10/19/18 | Sold | $185,000 | +76.2% | $137 / Sq Ft |
| 09/22/2018 09/22/18 | Pending | -- | -- | -- |
| 08/29/2018 08/29/18 | For Sale | $105,000 | -47.5% | $154 / Sq Ft |
| 08/24/2018 08/24/18 | Price Changed | $199,900 | +108.2% | $148 / Sq Ft |
| 08/17/2018 08/17/18 | Sold | $96,000 | +6.7% | $117 / Sq Ft |
| 07/24/2018 07/24/18 | Sold | $90,000 | -10.0% | $102 / Sq Ft |
| 06/12/2018 06/12/18 | Sold | $100,000 | +4.2% | $100 / Sq Ft |
| 06/03/2018 06/03/18 | Pending | -- | -- | -- |
| 05/24/2018 05/24/18 | Pending | -- | -- | -- |
| 05/22/2018 05/22/18 | For Sale | $96,000 | -52.9% | $117 / Sq Ft |
| 03/26/2018 03/26/18 | For Sale | $204,000 | +114.7% | $151 / Sq Ft |
| 03/09/2018 03/09/18 | For Sale | $95,000 | 0.0% | $107 / Sq Ft |
| 03/09/2018 03/09/18 | Price Changed | $95,000 | +5.6% | $107 / Sq Ft |
| 12/21/2017 12/21/17 | Off Market | $90,000 | -- | -- |
| 07/14/2017 07/14/17 | For Sale | $124,900 | -16.2% | $125 / Sq Ft |
| 09/09/2016 09/09/16 | For Sale | $149,000 | 0.0% | $169 / Sq Ft |
| 07/13/2016 07/13/16 | Rented | $1,400 | -99.1% | -- |
| 07/13/2016 07/13/16 | Under Contract | -- | -- | -- |
| 06/30/2016 06/30/16 | Sold | $150,000 | +25.3% | $153 / Sq Ft |
| 05/27/2016 05/27/16 | Sold | $119,750 | -11.3% | $190 / Sq Ft |
| 05/16/2016 05/16/16 | Pending | -- | -- | -- |
| 05/02/2016 05/02/16 | Pending | -- | -- | -- |
| 01/26/2016 01/26/16 | For Sale | $135,000 | 0.0% | $214 / Sq Ft |
| 11/13/2015 11/13/15 | For Rent | $239,000 | 0.0% | -- |
| 05/04/2015 05/04/15 | For Sale | $198,500 | -8.9% | $203 / Sq Ft |
| 08/22/2013 08/22/13 | Sold | $218,000 | -7.2% | $223 / Sq Ft |
| 04/26/2013 04/26/13 | Pending | -- | -- | -- |
| 04/25/2012 04/25/12 | For Sale | $235,000 | -- | $240 / Sq Ft |
Source: Huntington Board of REALTORS®
Purchase History
| Date | Type | Sale Price | Title Company |
|---|---|---|---|
| Deed | $173,000 | -- |
Source: Public Records
Mortgage History
| Date | Status | Loan Amount | Loan Type |
|---|---|---|---|
| Open | $132,000 | New Conventional |
Source: Public Records
Similar Homes in Huntington, WV
Source: Huntington Board of REALTORS®
MLS Number: 181100
APN: 05-17-02700020
Disclaimer: Certain information contained herein is derived from information provided by parties other than Homes.com. All information provided is deemed reliable, but is not guaranteed to be accurate and should be independently verified.
![]() IDX information is provided exclusively for personal, non-commercial use, and may not be used for any purpose other than to identify prospective properties consumers may be interested in purchasing.
IDX information is provided exclusively for personal, non-commercial use, and may not be used for any purpose other than to identify prospective properties consumers may be interested in purchasing.
Information is deemed reliable but not guaranteed.
Nearby Homes