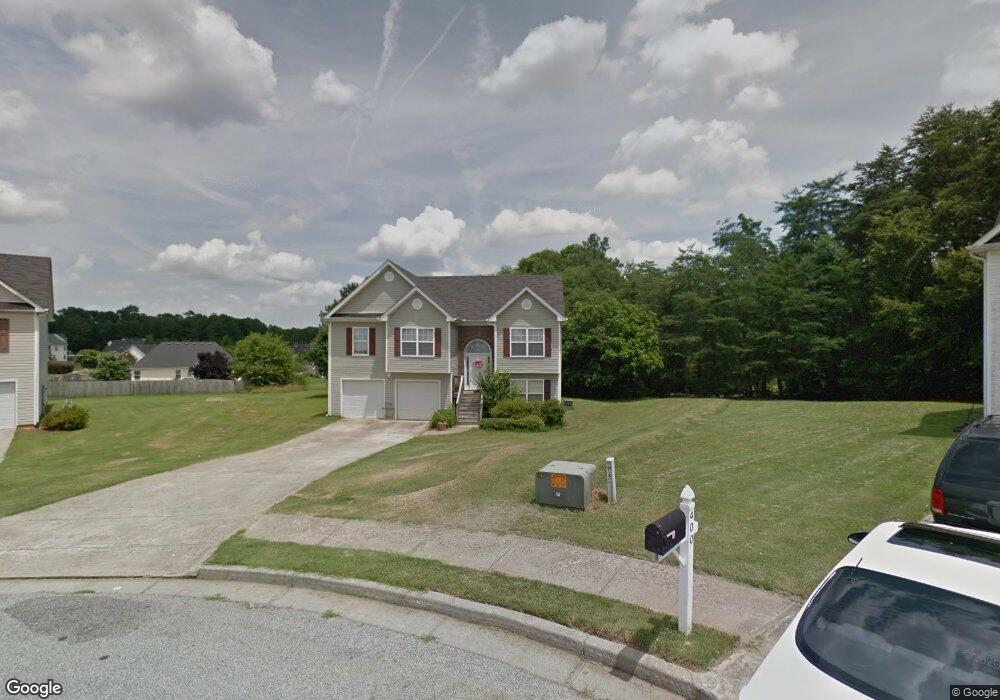
401 Armor Dr Loganville, GA 30052
Estimated Value: $335,000 - $365,000
4
Beds
2
Baths
1,867
Sq Ft
$188/Sq Ft
Est. Value
About This Home
This home is located at 401 Armor Dr, Loganville, GA 30052 and is currently estimated at $350,403, approximately $187 per square foot. 401 Armor Dr is a home located in Walton County with nearby schools including Bay Creek Elementary School, Loganville Middle School, and Loganville High School.
Ownership History
Date
Name
Owned For
Owner Type
Purchase Details
Closed on
Aug 31, 2022
Sold by
Crane Cynthia M
Bought by
Scott Wayde W
Current Estimated Value
Home Financials for this Owner
Home Financials are based on the most recent Mortgage that was taken out on this home.
Original Mortgage
$122,735
Outstanding Balance
$117,598
Interest Rate
5.62%
Mortgage Type
FHA
Estimated Equity
$232,805
Purchase Details
Closed on
Dec 12, 2011
Sold by
Federal Home Loan Mortgage Corporation
Bought by
Crane Cynthia M
Home Financials for this Owner
Home Financials are based on the most recent Mortgage that was taken out on this home.
Original Mortgage
$57,600
Interest Rate
4.06%
Mortgage Type
New Conventional
Purchase Details
Closed on
Feb 21, 2003
Sold by
Damascus Hms Llc
Bought by
Barnes Kim
Home Financials for this Owner
Home Financials are based on the most recent Mortgage that was taken out on this home.
Original Mortgage
$114,200
Interest Rate
5.95%
Mortgage Type
New Conventional
Create a Home Valuation Report for This Property
The Home Valuation Report is an in-depth analysis detailing your home's value as well as a comparison with similar homes in the area
Home Values in the Area
Average Home Value in this Area
Purchase History
| Date | Buyer | Sale Price | Title Company |
|---|---|---|---|
| Scott Wayde W | $125,000 | -- | |
| Crane Cynthia M | $72,000 | -- | |
| Barnes Kim | $142,800 | -- |
Source: Public Records
Mortgage History
| Date | Status | Borrower | Loan Amount |
|---|---|---|---|
| Open | Scott Wayde W | $122,735 | |
| Previous Owner | Crane Cynthia M | $57,600 | |
| Previous Owner | Barnes Kim | $114,200 |
Source: Public Records
Tax History Compared to Growth
Tax History
| Year | Tax Paid | Tax Assessment Tax Assessment Total Assessment is a certain percentage of the fair market value that is determined by local assessors to be the total taxable value of land and additions on the property. | Land | Improvement |
|---|---|---|---|---|
| 2024 | $4,406 | $118,280 | $20,400 | $97,880 |
| 2023 | $1,929 | $115,600 | $20,400 | $95,200 |
| 2022 | $3,183 | $105,120 | $18,000 | $87,120 |
| 2021 | $2,481 | $79,400 | $16,000 | $63,400 |
| 2020 | $2,331 | $72,680 | $14,400 | $58,280 |
| 2019 | $2,231 | $57,560 | $10,000 | $47,560 |
| 2018 | $1,848 | $57,560 | $10,000 | $47,560 |
| 2017 | $2,385 | $54,120 | $10,000 | $44,120 |
| 2016 | $1,737 | $51,960 | $10,000 | $41,960 |
| 2015 | $1,444 | $42,680 | $8,800 | $33,880 |
| 2014 | $1,381 | $39,600 | $0 | $0 |
Source: Public Records
Map
Nearby Homes
- 209 Birchwood Dr
- 207 Birchwood Dr
- 503 Starmist Ct
- 204 Misty Grove Dr
- 612 Baymist Ct
- 232 Misty Grove Dr
- 3971 Dean Grove Way
- 4031 Dean Grove Way
- 501 Bay Stand Ln
- 606 Amanda Leigh Ct
- 4500 Bay Creek Rd
- 4885 Watson Mill Ct
- 229 Traditions Dr SE
- 417 Mockingbird Dr
- 2524 Lois Ct
- 3898 Bay Creek Rd
- 969 Spanish Moss Trail
- 403 Armor Dr
- 400 Armor Dr
- 217 Birchwood Dr Unit 9
- 508 Hamlet Dr
- 506 Hamlet Dr
- 506 Hamlet Dr Unit 21
- 215 Birchwood Dr Unit 8
- 215 Birchwood Dr
- 219 Birchwood Dr Unit 10
- 219 Birchwood Dr
- 510 Hamlet Dr
- 504 Hamlet Dr
- 411 Armor Dr
- 413 Armor Dr
- 402 Armor Dr
- 415 Armor Dr
- 213 Birchwood Dr
- 221 Birchwood Dr
- 404 Armor Dr
- 0 Hamlet Dr Unit 8486829