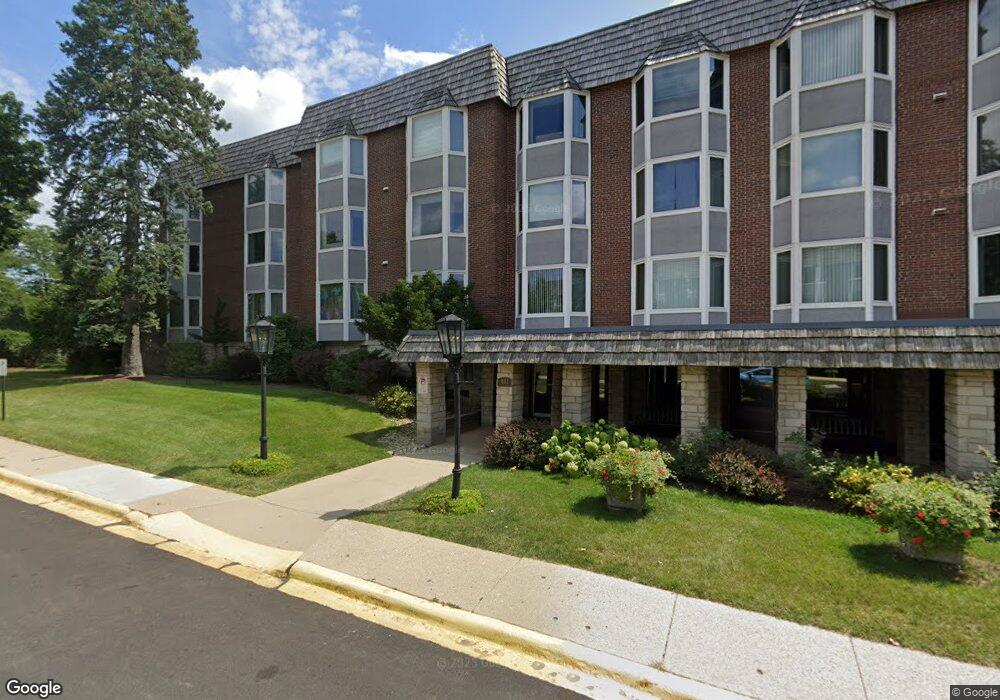
401 Ascot Dr Unit 1 Park Ridge, IL 60068
Estimated Value: $262,488 - $336,000
2
Beds
--
Bath
--
Sq Ft
20.03
Acres
About This Home
This home is located at 401 Ascot Dr Unit 1, Park Ridge, IL 60068 and is currently estimated at $286,122. 401 Ascot Dr Unit 1 is a home located in Cook County with nearby schools including George Washington Elementary School, Lincoln Middle School, and Maine South High School.
Ownership History
Date
Name
Owned For
Owner Type
Purchase Details
Closed on
Feb 22, 2013
Sold by
Jpmorgan Chase Bank Na
Bought by
Lamonica J La
Current Estimated Value
Purchase Details
Closed on
Apr 5, 2012
Sold by
Bristol Court Condominium Association
Bought by
Jpmorgan Chase Bank Na
Purchase Details
Closed on
Aug 30, 2007
Sold by
Dominik Ruth Alice
Bought by
Leontios Thomas G
Home Financials for this Owner
Home Financials are based on the most recent Mortgage that was taken out on this home.
Original Mortgage
$192,950
Interest Rate
6.49%
Mortgage Type
Unknown
Purchase Details
Closed on
Nov 16, 2004
Sold by
Dominik Ruth Alice
Bought by
Dominik Ruth Alice and Ruth Alice Dominik Revocable Living Tr
Purchase Details
Closed on
Oct 28, 1999
Sold by
Marshall Patrick M
Bought by
Dominik Ruth Alice
Create a Home Valuation Report for This Property
The Home Valuation Report is an in-depth analysis detailing your home's value as well as a comparison with similar homes in the area
Home Values in the Area
Average Home Value in this Area
Purchase History
| Date | Buyer | Sale Price | Title Company |
|---|---|---|---|
| Lamonica J La | $125,122 | None Available | |
| Jpmorgan Chase Bank Na | -- | None Available | |
| Leontios Thomas G | $227,000 | Republic Title Co | |
| Dominik Ruth Alice | -- | Attorneys Title Guaranty Fun | |
| Dominik Ruth Alice | $150,000 | -- |
Source: Public Records
Mortgage History
| Date | Status | Borrower | Loan Amount |
|---|---|---|---|
| Previous Owner | Leontios Thomas G | $192,950 |
Source: Public Records
Tax History Compared to Growth
Tax History
| Year | Tax Paid | Tax Assessment Tax Assessment Total Assessment is a certain percentage of the fair market value that is determined by local assessors to be the total taxable value of land and additions on the property. | Land | Improvement |
|---|---|---|---|---|
| 2024 | $5,116 | $18,852 | $1,434 | $17,418 |
| 2023 | $4,902 | $18,852 | $1,434 | $17,418 |
| 2022 | $4,902 | $18,852 | $1,434 | $17,418 |
| 2021 | $4,533 | $14,905 | $1,741 | $13,164 |
| 2020 | $4,353 | $14,905 | $1,741 | $13,164 |
| 2019 | $4,359 | $16,726 | $1,741 | $14,985 |
| 2018 | $3,636 | $12,707 | $1,536 | $11,171 |
| 2017 | $3,621 | $12,707 | $1,536 | $11,171 |
| 2016 | $3,486 | $12,707 | $1,536 | $11,171 |
| 2015 | $3,184 | $10,325 | $1,331 | $8,994 |
| 2014 | $3,122 | $10,325 | $1,331 | $8,994 |
| 2013 | $2,957 | $10,325 | $1,331 | $8,994 |
Source: Public Records
Map
Nearby Homes
- 414 S Dee Rd Unit 13
- 2500 Archbury Ln Unit 2D
- 2300 Windsor Mall Unit 1F
- 2300 Windsor Mall Unit 2E
- 500 Thames Pkwy Unit 1F
- 200 Thames Pkwy Unit 1
- 2500 Windsor Mall Unit 1J
- 60 S Dee Rd Unit G
- 20 S Dee Rd
- 516 Engel Blvd
- 44 Park Ln Unit 223
- 44 Park Ln Unit 435
- 22 Park Ln Unit 203
- 300 Boardwalk Place Unit T300
- 38 E Touhy Ave
- 2166 Laura Ln
- 929 S Aldine Ave
- 408 N Seminary Ave
- 2121 W Sibley St
- 1301 W Touhy Ave Unit 315
- 401 Ascot Dr Unit 1E
- 401 Ascot Dr Unit 1
- 401 Ascot Dr Unit 1
- 401 Ascot Dr Unit 1
- 401 Ascot Dr Unit 1
- 401 Ascot Dr Unit 1
- 401 Ascot Dr Unit 1
- 401 Ascot Dr Unit 1
- 401 Ascot Dr Unit 1
- 401 Ascot Dr Unit 1
- 401 Ascot Dr Unit 1
- 401 Ascot Dr Unit 1
- 401 Ascot Dr Unit 1
- 401 Ascot Dr Unit 1
- 401 Ascot Dr Unit 1
- 401 Ascot Dr Unit 1
- 401 Ascot Dr Unit 1
- 401 Ascot Dr Unit 1
- 401 Ascot Dr Unit 1
- 401 Ascot Dr Unit 1