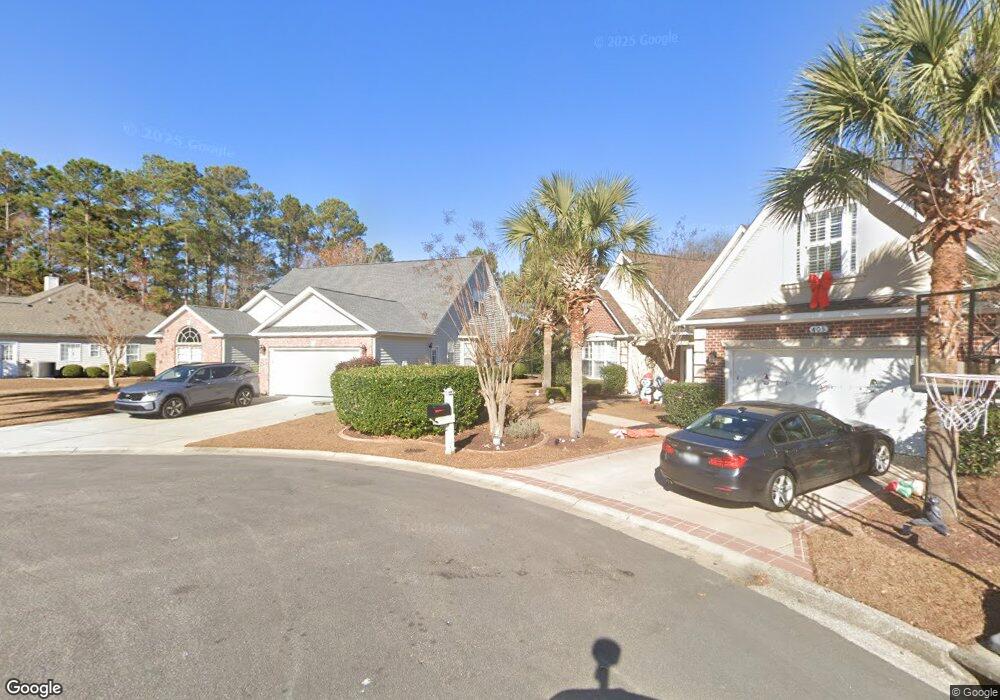
401 Backwater Ct Unit Limestone Myrtle Beach, SC 29579
Estimated Value: $480,341 - $552,000
5
Beds
4
Baths
2,960
Sq Ft
$175/Sq Ft
Est. Value
About This Home
This home is located at 401 Backwater Ct Unit Limestone, Myrtle Beach, SC 29579 and is currently estimated at $517,585, approximately $174 per square foot. 401 Backwater Ct Unit Limestone is a home located in Horry County with nearby schools including River Oaks Elementary School, Ten Oaks Middle, and Carolina Forest High School.
Ownership History
Date
Name
Owned For
Owner Type
Purchase Details
Closed on
Jul 29, 2015
Sold by
Tregde Donald J and Tregde Toni M
Bought by
Tapp Brock A and Tapp Amanda M
Current Estimated Value
Home Financials for this Owner
Home Financials are based on the most recent Mortgage that was taken out on this home.
Original Mortgage
$264,900
Outstanding Balance
$206,058
Interest Rate
4.11%
Estimated Equity
$311,527
Purchase Details
Closed on
Aug 30, 2012
Sold by
Boyce Michael Grey
Bought by
Tregde Donald J
Purchase Details
Closed on
Jul 31, 2012
Sold by
Master In Equity Horry County
Bought by
Boyce Michael Grey
Purchase Details
Closed on
Jul 22, 2005
Sold by
D R Horton Inc
Bought by
Mclean David S and Mclean Regina C
Purchase Details
Closed on
Nov 3, 2004
Sold by
Limestone Properties Llc
Bought by
D R Horton Inc
Create a Home Valuation Report for This Property
The Home Valuation Report is an in-depth analysis detailing your home's value as well as a comparison with similar homes in the area
Home Values in the Area
Average Home Value in this Area
Purchase History
| Date | Buyer | Sale Price | Title Company |
|---|---|---|---|
| Tapp Brock A | $274,900 | -- | |
| Tregde Donald J | $205,000 | -- | |
| Boyce Michael Grey | $157,000 | -- | |
| Mclean David S | $289,116 | -- | |
| D R Horton Inc | $95,994 | -- |
Source: Public Records
Mortgage History
| Date | Status | Borrower | Loan Amount |
|---|---|---|---|
| Open | Tapp Brock A | $264,900 |
Source: Public Records
Tax History
| Year | Tax Paid | Tax Assessment Tax Assessment Total Assessment is a certain percentage of the fair market value that is determined by local assessors to be the total taxable value of land and additions on the property. | Land | Improvement |
|---|---|---|---|---|
| 2025 | -- | $0 | $0 | $0 |
| 2024 | -- | $17,147 | $5,000 | $12,147 |
| 2023 | $1,265 | $11,122 | $2,382 | $8,740 |
| 2021 | $1,141 | $11,122 | $2,382 | $8,740 |
| 2020 | $1,012 | $11,122 | $2,382 | $8,740 |
| 2019 | $1,012 | $11,122 | $2,382 | $8,740 |
| 2018 | $1,024 | $10,925 | $1,621 | $9,304 |
| 2017 | $1,009 | $10,925 | $1,621 | $9,304 |
| 2016 | -- | $10,925 | $1,621 | $9,304 |
| 2015 | $993 | $10,925 | $1,621 | $9,304 |
| 2014 | $915 | $10,925 | $1,621 | $9,304 |
Source: Public Records
Map
Nearby Homes
- 611 Needlerush Ct Unit MB
- 128 Abcaw Blvd
- 801 Abalone Ct Unit MB
- 1224 Safe Haven Dr
- 673 Tidal Point Ln
- 908 Adaline Ct
- 325 Vesta Dr
- 668 Barona Dr
- 117 Bleckley Ave
- 2108 Ballast Ct
- 1175 Safe Haven Dr
- 2004 Tiller Ct
- 1180 Safe Haven Dr
- 1196 Safe Haven Dr
- 805 Covelo Ln
- 860 Gammon Dr
- 809 Covelo Ln
- 478 Harbour View Dr
- 844 Gammon Dr
- 825 Falkirk St
- 401 Backwater Ct
- 13 Abcaw Blvd
- 105 Abcaw Blvd
- 405 Backwater Ct Unit Arrowhead-Limestone
- 405 Backwater Ct
- 404 Backwater Ct Unit LIMESTONE SECTION
- 404 Backwater Ct
- 600 Needlerush Ct
- 104 Abcaw Blvd Unit Limestone - Arrowhea
- 104 Abcaw Blvd
- 104 Abcaw Blvd Unit Limestone
- 113 Abcaw Blvd Unit MB
- 601 Needlerush Ct
- 108 Abcaw Blvd
- 604 Needlerush Ct
- 603 Needlerush Ct
- 116 Abcaw Blvd
- 112 Abcaw Blvd
- 120 Abcaw Blvd Unit MB
- 605 Needlerush Ct Unit Sandalwood
Your Personal Tour Guide
Ask me questions while you tour the home.