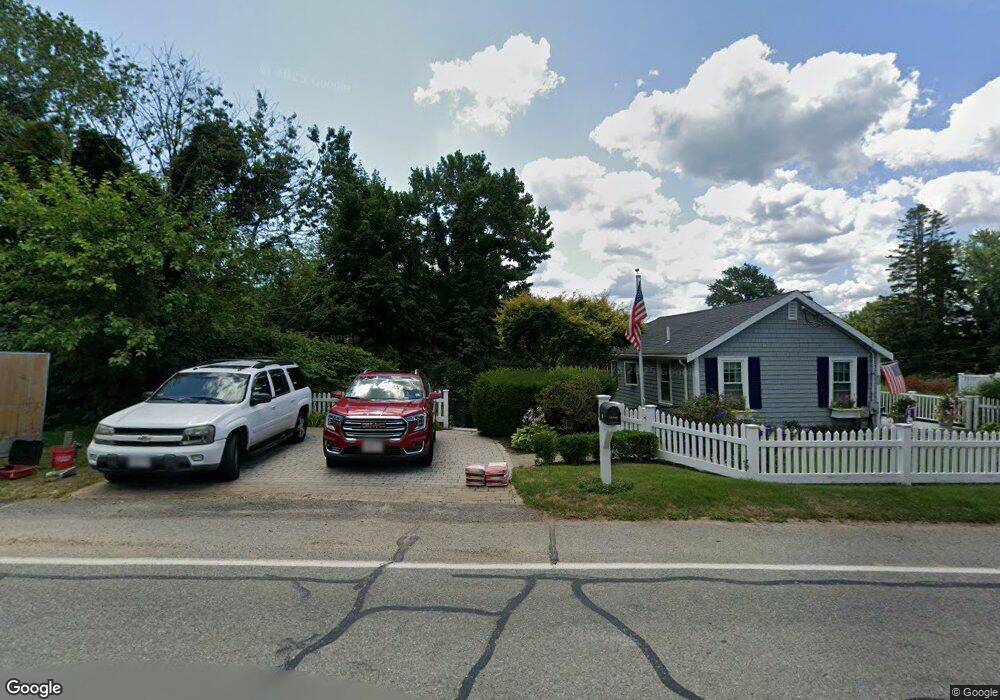
401 Bay Rd Duxbury, MA 02332
South Duxbury NeighborhoodEstimated Value: $506,000 - $623,000
1
Bed
1
Bath
760
Sq Ft
$744/Sq Ft
Est. Value
About This Home
This home is located at 401 Bay Rd, Duxbury, MA 02332 and is currently estimated at $565,314, approximately $743 per square foot. 401 Bay Rd is a home located in Plymouth County with nearby schools including Chandler Elementary School, Alden School, and Duxbury Middle School.
Ownership History
Date
Name
Owned For
Owner Type
Purchase Details
Closed on
Oct 11, 2017
Sold by
Cattaneo Thomas S and Cattaneo Jayne M
Bought by
Cattaneo Ft
Current Estimated Value
Purchase Details
Closed on
Feb 18, 2010
Sold by
Cattaneo Thomas S and Cattaneo Jayne Joyce
Bought by
Cattaneo Thomas S and Cattaneo Jayne M
Home Financials for this Owner
Home Financials are based on the most recent Mortgage that was taken out on this home.
Original Mortgage
$200,000
Interest Rate
5.17%
Mortgage Type
Purchase Money Mortgage
Purchase Details
Closed on
Jun 19, 2003
Sold by
Cattaneo Thomas S
Bought by
Cattaneo Thomas S and Cattaneo Jayne Joyce
Purchase Details
Closed on
Sep 1, 1993
Sold by
Dougherty James J and Dougherty Ruth E
Bought by
Cattaneo Thomas S and Wright Constance
Create a Home Valuation Report for This Property
The Home Valuation Report is an in-depth analysis detailing your home's value as well as a comparison with similar homes in the area
Home Values in the Area
Average Home Value in this Area
Purchase History
| Date | Buyer | Sale Price | Title Company |
|---|---|---|---|
| Cattaneo Ft | -- | -- | |
| Cattaneo Thomas S | -- | -- | |
| Cattaneo Thomas S | -- | -- | |
| Cattaneo Thomas S | $96,000 | -- |
Source: Public Records
Mortgage History
| Date | Status | Borrower | Loan Amount |
|---|---|---|---|
| Previous Owner | Cattaneo Thomas S | $220,000 | |
| Previous Owner | Cattaneo Thomas S | $200,000 | |
| Previous Owner | Cattaneo Thomas S | $50,000 |
Source: Public Records
Tax History Compared to Growth
Tax History
| Year | Tax Paid | Tax Assessment Tax Assessment Total Assessment is a certain percentage of the fair market value that is determined by local assessors to be the total taxable value of land and additions on the property. | Land | Improvement |
|---|---|---|---|---|
| 2025 | $4,232 | $417,400 | $301,300 | $116,100 |
| 2024 | $3,568 | $354,700 | $229,500 | $125,200 |
| 2023 | $3,906 | $365,400 | $236,800 | $128,600 |
| 2022 | $3,563 | $277,500 | $164,100 | $113,400 |
| 2021 | $4,167 | $287,800 | $175,400 | $112,400 |
| 2020 | $3,922 | $267,500 | $166,000 | $101,500 |
| 2019 | $3,839 | $261,500 | $154,200 | $107,300 |
| 2018 | $3,904 | $257,500 | $142,300 | $115,200 |
| 2017 | $4,104 | $264,600 | $142,700 | $121,900 |
| 2016 | $4,020 | $258,500 | $136,600 | $121,900 |
| 2015 | $3,703 | $237,400 | $115,500 | $121,900 |
Source: Public Records
Map
Nearby Homes
- 10 Summerhouse Ln
- 59 Priscilla Ave
- 66 Seabury Point Rd
- 6 Priscilla Rd
- 117 Soule Ave
- 19 Flint Locke Dr
- 30 Cushing Dr
- 20 Island Creek Rd
- 735 Bay Rd
- 124 Evergreen St
- 53 Bay Farm Rd Unit 53
- 104 Standish St
- 65 Myles View Dr
- 40 Bay Farm Rd Unit 40
- 80 Parks St Unit 6
- 80 Parks St Unit 5
- 5 Page Ave
- 0 Standish St
- 65 Tussock Brook Rd
- 68 Depot St