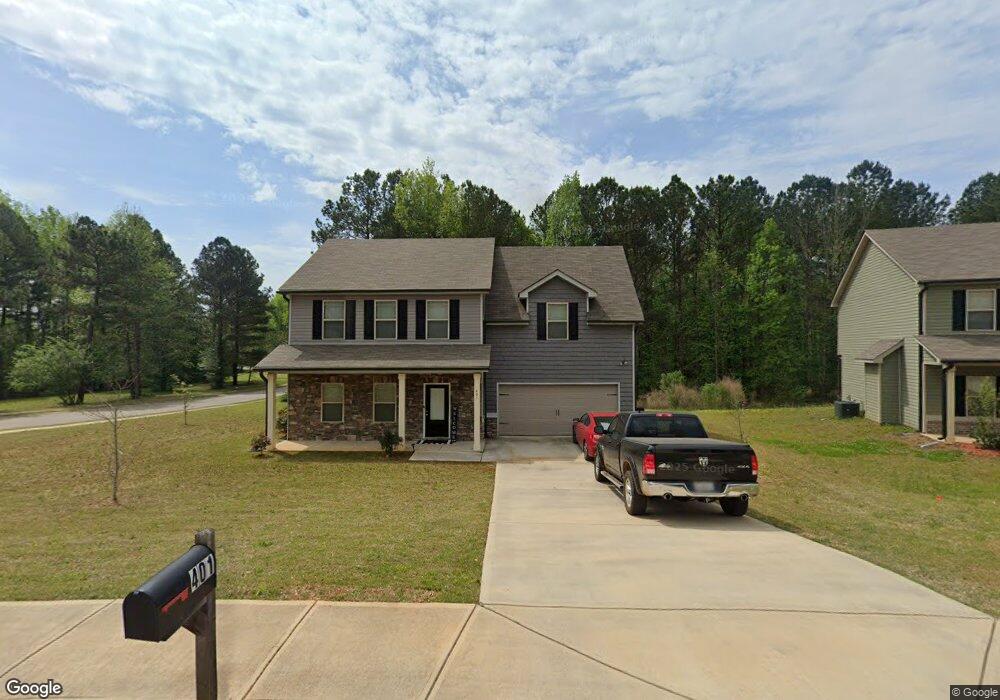
401 Camella Cir Unit 108 McDonough, GA 30252
Estimated Value: $298,000 - $318,000
4
Beds
3
Baths
1,968
Sq Ft
$155/Sq Ft
Est. Value
About This Home
This home is located at 401 Camella Cir Unit 108, McDonough, GA 30252 and is currently estimated at $305,581, approximately $155 per square foot. 401 Camella Cir Unit 108 is a home located in Henry County with nearby schools including Tussahaw Elementary School, McDonough Middle School, and New Creation Christian Academy.
Ownership History
Date
Name
Owned For
Owner Type
Purchase Details
Closed on
Feb 28, 2025
Sold by
Newsome Torre D
Bought by
Solomon Jovan Julian
Current Estimated Value
Home Financials for this Owner
Home Financials are based on the most recent Mortgage that was taken out on this home.
Original Mortgage
$297,020
Outstanding Balance
$295,153
Interest Rate
6.62%
Mortgage Type
FHA
Estimated Equity
$10,428
Purchase Details
Closed on
Aug 17, 2018
Sold by
Bst Homes Llc
Bought by
Newsome Torre D
Home Financials for this Owner
Home Financials are based on the most recent Mortgage that was taken out on this home.
Original Mortgage
$171,731
Interest Rate
4.87%
Mortgage Type
FHA
Purchase Details
Closed on
May 22, 2018
Sold by
Koppar Corp
Bought by
Bst Homes Llc
Home Financials for this Owner
Home Financials are based on the most recent Mortgage that was taken out on this home.
Original Mortgage
$134,400
Interest Rate
4.5%
Mortgage Type
New Conventional
Create a Home Valuation Report for This Property
The Home Valuation Report is an in-depth analysis detailing your home's value as well as a comparison with similar homes in the area
Home Values in the Area
Average Home Value in this Area
Purchase History
| Date | Buyer | Sale Price | Title Company |
|---|---|---|---|
| Solomon Jovan Julian | $302,500 | -- | |
| Newsome Torre D | $174,900 | -- | |
| Bst Homes Llc | $7,500 | -- |
Source: Public Records
Mortgage History
| Date | Status | Borrower | Loan Amount |
|---|---|---|---|
| Open | Solomon Jovan Julian | $297,020 | |
| Previous Owner | Newsome Torre D | $171,731 | |
| Previous Owner | Bst Homes Llc | $134,400 |
Source: Public Records
Tax History Compared to Growth
Tax History
| Year | Tax Paid | Tax Assessment Tax Assessment Total Assessment is a certain percentage of the fair market value that is determined by local assessors to be the total taxable value of land and additions on the property. | Land | Improvement |
|---|---|---|---|---|
| 2025 | $4,752 | $127,560 | $22,000 | $105,560 |
| 2024 | $4,752 | $115,200 | $22,000 | $93,200 |
| 2023 | $4,244 | $113,200 | $18,000 | $95,200 |
| 2022 | $3,909 | $101,920 | $18,000 | $83,920 |
| 2021 | $3,134 | $79,920 | $14,000 | $65,920 |
| 2020 | $2,898 | $73,480 | $10,000 | $63,480 |
| 2019 | $2,737 | $67,360 | $10,800 | $56,560 |
| 2018 | $432 | $10,800 | $10,800 | $0 |
| 2016 | $243 | $6,000 | $6,000 | $0 |
| 2015 | $242 | $4,800 | $4,800 | $0 |
| 2014 | $198 | $4,800 | $4,800 | $0 |
Source: Public Records
Map
Nearby Homes
- 308 Stallings Dr
- 628 Stevens Place
- 6195 Winston Trace
- 4110 Mission Way
- 5310 Tussahaw Crossing
- 4025 Mission Way
- 0 Nail Mill Rd
- 2075 Tussahaw Crossing
- 6035 Flagstaf Walk
- 6005 Winston Trace
- 1750 Courtyard Ln
- 1805 Midcourt Way Unit 3
- 80 Wise Rd
- 6033 Creekerton Blvd
- 6041 Creekerton Blvd
- 1590 Township Terrace Unit 1
- 720 City Park Dr
- 224 Osier Dr
- 450 Noblewood Dr
- 446 Noblewood Dr
- 403 Camella Cir Unit 109
- 403 Camella Cir
- 143 Sanders Walk
- 405 Camella Cir Unit 110
- 400 Camella Cir Unit 102
- 400 Camella Cir
- 400 Camella Cir Unit GA1434
- 400 Camella Cir
- 400 Camella Cir Unit GA14340
- 145 Sanders Walk
- 404 Camella Cir
- 147 Sanders Walk
- 407 Camella Cir
- 408 Camella Cir
- 150 Sanders Walk
- 149 Sanders Walk
- 409 Camella Cir
- 602 Benjamin Ct
- 412 Camella Cir
- 151 Sanders Walk