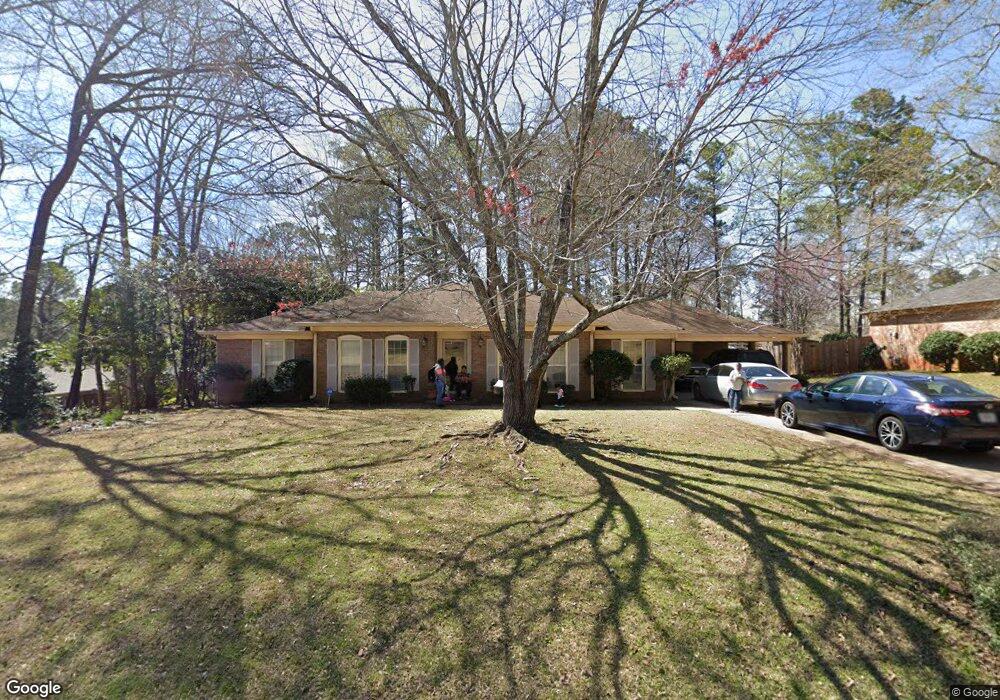
401 Camelot Dr Unit 50 Lagrange, GA 30241
Estimated Value: $231,255 - $260,000
3
Beds
2
Baths
1,976
Sq Ft
$124/Sq Ft
Est. Value
About This Home
This home is located at 401 Camelot Dr Unit 50, Lagrange, GA 30241 and is currently estimated at $245,314, approximately $124 per square foot. 401 Camelot Dr Unit 50 is a home located in Troup County with nearby schools including Franklin Forest Elementary School, Hollis Hand Elementary School, and Ethel W. Kight Elementary School.
Ownership History
Date
Name
Owned For
Owner Type
Purchase Details
Closed on
Sep 15, 2020
Sold by
Grimes Raymond L
Bought by
Sands Angelon K
Current Estimated Value
Home Financials for this Owner
Home Financials are based on the most recent Mortgage that was taken out on this home.
Original Mortgage
$160,000
Outstanding Balance
$141,989
Interest Rate
2.9%
Mortgage Type
VA
Estimated Equity
$103,325
Purchase Details
Closed on
Oct 23, 2006
Sold by
Bond Albert Lathon
Bought by
Grimes Raymond L
Home Financials for this Owner
Home Financials are based on the most recent Mortgage that was taken out on this home.
Original Mortgage
$114,400
Interest Rate
6.31%
Mortgage Type
New Conventional
Purchase Details
Closed on
Sep 16, 1985
Bought by
Bond Albert L and Bond Lula M
Purchase Details
Closed on
Jun 14, 1982
Sold by
Laura William and Laura Harlin
Purchase Details
Closed on
Dec 13, 1976
Sold by
Lagrange Investment Co
Bought by
Laura William and Laura Harlin
Create a Home Valuation Report for This Property
The Home Valuation Report is an in-depth analysis detailing your home's value as well as a comparison with similar homes in the area
Home Values in the Area
Average Home Value in this Area
Purchase History
| Date | Buyer | Sale Price | Title Company |
|---|---|---|---|
| Sands Angelon K | $165,000 | -- | |
| Grimes Raymond L | $143,000 | -- | |
| Grimes Raymond L | $143,000 | -- | |
| Bond Albert L | $45,300 | -- | |
| -- | -- | -- | |
| Laura William | -- | -- |
Source: Public Records
Mortgage History
| Date | Status | Borrower | Loan Amount |
|---|---|---|---|
| Open | Sands Angelon K | $160,000 | |
| Previous Owner | Grimes Raymond L | $114,400 |
Source: Public Records
Tax History Compared to Growth
Tax History
| Year | Tax Paid | Tax Assessment Tax Assessment Total Assessment is a certain percentage of the fair market value that is determined by local assessors to be the total taxable value of land and additions on the property. | Land | Improvement |
|---|---|---|---|---|
| 2024 | $1,934 | $80,564 | $10,000 | $70,564 |
| 2023 | $1,934 | $72,888 | $10,000 | $62,888 |
| 2022 | $1,882 | $69,408 | $10,000 | $59,408 |
| 2021 | $1,765 | $60,500 | $8,000 | $52,500 |
| 2020 | $1,580 | $52,380 | $8,000 | $44,380 |
| 2019 | $1,536 | $50,944 | $8,000 | $42,944 |
| 2018 | $1,415 | $46,928 | $8,320 | $38,608 |
| 2017 | $1,415 | $46,928 | $8,320 | $38,608 |
| 2016 | $1,390 | $46,079 | $8,320 | $37,759 |
| 2015 | $1,392 | $46,079 | $8,320 | $37,759 |
| 2014 | $1,165 | $38,502 | $8,320 | $30,182 |
| 2013 | -- | $40,640 | $8,320 | $32,320 |
Source: Public Records
Map
Nearby Homes
- 109 Dogwood Dr
- 210 Hearthstone Dr
- 706 N Harlem Cir
- 618 S Harlem Cir
- 616 S Harlem Cir
- 608 S Harlem Cir
- 606 S Harlem Cir
- 600 S Harlem Cir
- 121 Ct
- 131 Foch St
- 806 New Franklin Rd
- 114 Briarcliff Rd
- 900 North St
- 110 Russell St
- 305 Lenox Cir
- 204 Colonial St
- 600,606,608,616 S Harlem
- 105 Lenox Cir
- 101 Lenox Cir
- 130 Clara Jean Ct
- 401 Camelot Dr
- 403 Camelot Dr
- 470 Hickory Terrace
- 468 Hickory Terrace
- 402 Camelot Dr
- 405 Camelot Dr
- 304 Valley Ct
- 306 Valley Ct
- 0 Camelot Ct Unit 8195774
- 400 Camelot Dr
- 404 Camelot Dr
- 500 Hickory Terrace
- 466 Hickory Terrace Unit 32
- 308 Valley Ct
- 407 Camelot Dr
- 467 Hickory Terrace
- 302 Valley Ct
- 406 Camelot Dr
- 501 Hickory Terrace
- 501 Hickory Terrace Unit 1