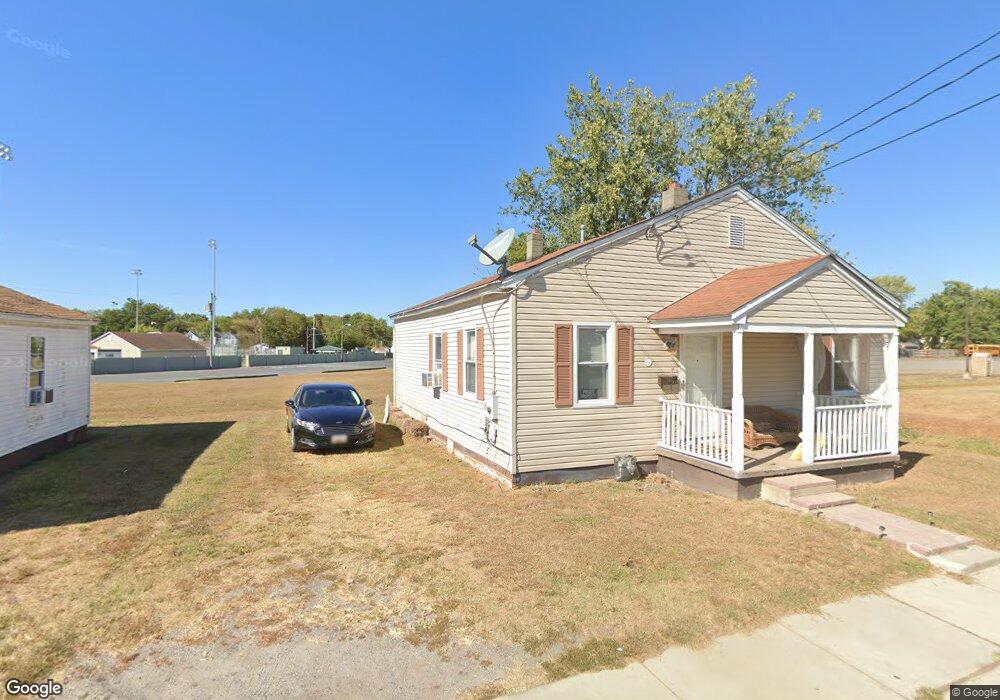
401 Camper St Cambridge, MD 21613
Estimated Value: $79,369 - $113,000
2
Beds
1
Bath
1,024
Sq Ft
$95/Sq Ft
Est. Value
About This Home
This home is located at 401 Camper St, Cambridge, MD 21613 and is currently estimated at $97,342, approximately $95 per square foot. 401 Camper St is a home located in Dorchester County with nearby schools including Sandy Hill Elementary School, Mace's Lane Middle School, and Cambridge-South Dorchester High School.
Ownership History
Date
Name
Owned For
Owner Type
Purchase Details
Closed on
Dec 8, 2011
Sold by
U S Bank National Association
Bought by
Knox John R
Current Estimated Value
Purchase Details
Closed on
Aug 8, 2011
Sold by
Blake Doris
Bought by
Us Bank National Association Trust
Purchase Details
Closed on
May 18, 2011
Sold by
Blake Doris
Bought by
U S Bank National Association
Purchase Details
Closed on
Mar 19, 2001
Sold by
Neighborhood Housing Renewal Co
Bought by
Blake Doris
Create a Home Valuation Report for This Property
The Home Valuation Report is an in-depth analysis detailing your home's value as well as a comparison with similar homes in the area
Home Values in the Area
Average Home Value in this Area
Purchase History
| Date | Buyer | Sale Price | Title Company |
|---|---|---|---|
| Knox John R | $31,500 | None Available | |
| Us Bank National Association Trust | $51,000 | -- | |
| U S Bank National Association | $51,000 | None Available | |
| Us Bank National Association Trust | $51,000 | -- | |
| Blake Doris | $53,000 | -- |
Source: Public Records
Mortgage History
| Date | Status | Borrower | Loan Amount |
|---|---|---|---|
| Closed | Blake Doris | -- |
Source: Public Records
Tax History Compared to Growth
Tax History
| Year | Tax Paid | Tax Assessment Tax Assessment Total Assessment is a certain percentage of the fair market value that is determined by local assessors to be the total taxable value of land and additions on the property. | Land | Improvement |
|---|---|---|---|---|
| 2025 | $748 | $39,800 | $6,000 | $33,800 |
| 2024 | $627 | $36,867 | $0 | $0 |
| 2023 | $627 | $33,933 | $0 | $0 |
| 2022 | $573 | $31,000 | $6,000 | $25,000 |
| 2021 | $573 | $30,700 | $0 | $0 |
| 2020 | $573 | $30,400 | $0 | $0 |
| 2019 | $574 | $30,100 | $6,000 | $24,100 |
| 2018 | $559 | $30,100 | $6,000 | $24,100 |
| 2017 | $559 | $30,100 | $0 | $0 |
| 2016 | -- | $31,300 | $0 | $0 |
| 2015 | -- | $30,933 | $0 | $0 |
| 2014 | -- | $30,567 | $0 | $0 |
Source: Public Records
Map
Nearby Homes