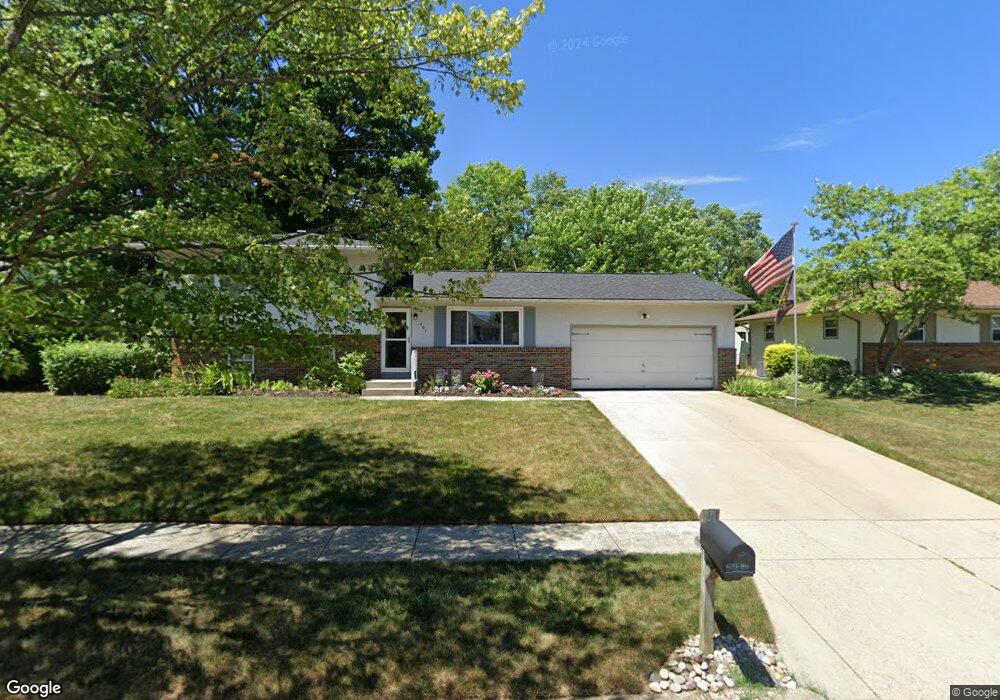
401 Citadel St Columbus, OH 43230
Gahanna-Havens Corners NeighborhoodEstimated Value: $325,203 - $335,000
4
Beds
2
Baths
1,574
Sq Ft
$210/Sq Ft
Est. Value
About This Home
This home is located at 401 Citadel St, Columbus, OH 43230 and is currently estimated at $330,551, approximately $210 per square foot. 401 Citadel St is a home located in Franklin County with nearby schools including Goshen Lane Elementary School, Gahanna West Middle School, and Lincoln High School.
Ownership History
Date
Name
Owned For
Owner Type
Purchase Details
Closed on
Aug 2, 2023
Sold by
Reynolds Sandra
Bought by
Reynolds Sandra and Reynolds Scott C
Current Estimated Value
Purchase Details
Closed on
Jul 12, 2023
Sold by
Reynolds Sandra
Bought by
Reynolds Sandra and Reynolds Scott C
Purchase Details
Closed on
Mar 21, 2019
Bought by
Reynolds Sandra
Purchase Details
Closed on
Oct 22, 2010
Sold by
Perry Brandi and Estate Of Phyllis Brandt
Bought by
Phillips Sandra A
Home Financials for this Owner
Home Financials are based on the most recent Mortgage that was taken out on this home.
Original Mortgage
$137,153
Interest Rate
4.5%
Mortgage Type
FHA
Purchase Details
Closed on
Sep 25, 1997
Sold by
Estate Of Robert F Brandt
Bought by
Brandt Phyllis
Create a Home Valuation Report for This Property
The Home Valuation Report is an in-depth analysis detailing your home's value as well as a comparison with similar homes in the area
Home Values in the Area
Average Home Value in this Area
Purchase History
| Date | Buyer | Sale Price | Title Company |
|---|---|---|---|
| Reynolds Sandra | -- | None Listed On Document | |
| Reynolds Sandra | -- | None Listed On Document | |
| Reynolds Sandra | -- | -- | |
| Phillips Sandra A | $139,000 | Chicago Tit | |
| Brandt Phyllis | -- | -- |
Source: Public Records
Mortgage History
| Date | Status | Borrower | Loan Amount |
|---|---|---|---|
| Previous Owner | Phillips Sandra A | $137,153 |
Source: Public Records
Tax History Compared to Growth
Tax History
| Year | Tax Paid | Tax Assessment Tax Assessment Total Assessment is a certain percentage of the fair market value that is determined by local assessors to be the total taxable value of land and additions on the property. | Land | Improvement |
|---|---|---|---|---|
| 2024 | $5,526 | $93,810 | $33,360 | $60,450 |
| 2023 | $5,569 | $93,810 | $33,360 | $60,450 |
| 2022 | $5,104 | $65,000 | $15,860 | $49,140 |
| 2021 | $4,945 | $65,000 | $15,860 | $49,140 |
| 2020 | $4,906 | $65,000 | $15,860 | $49,140 |
| 2019 | $3,987 | $54,190 | $13,200 | $40,990 |
| 2018 | $3,753 | $54,190 | $13,200 | $40,990 |
| 2017 | $3,570 | $54,190 | $13,200 | $40,990 |
| 2016 | $3,641 | $50,340 | $12,920 | $37,420 |
| 2015 | $3,644 | $50,340 | $12,920 | $37,420 |
| 2014 | $3,616 | $50,340 | $12,920 | $37,420 |
| 2013 | $1,796 | $50,330 | $12,915 | $37,415 |
Source: Public Records
Map
Nearby Homes
- 390 Dunbarton Rd
- 407 Denison Ave
- 600 Agler Rd
- 183 Serran Dr
- 209 Imperial Dr
- 0 Mifflin Blvd
- 2876 Johnstown Rd
- 0 E Emmons Ave
- 0 E Minnesota Ave Unit 224018641
- 3888 Agler Rd
- 278 Empire Dr
- 198 Gary Lee Dr
- 1822 Stelzer Rd
- 221 Lincolnshire Rd
- 3784 Armuth Ave
- 343 Imperial Dr
- 206 Lintner St
- 2051 Stelzer Rd
- 404 Foxwood Dr
- 2275 Stelzer Rd
- 409 Citadel St
- 393 Citadel St
- 320 Denison Ave
- 417 Citadel St
- 305 Muskingum Dr
- 324 Denison Ct
- 313 Muskingum Dr
- 402 Citadel St
- 316 Denison Ave
- 394 Citadel St
- 410 Citadel St
- 321 Muskingum Dr
- 285 Muskingum Dr
- 418 Citadel St
- 328 Denison Ct
- 329 Muskingum Dr
- 306 Muskingum Dr
- 303 Denison Ave
- 307 Denison Ave
- 403 Xavier St