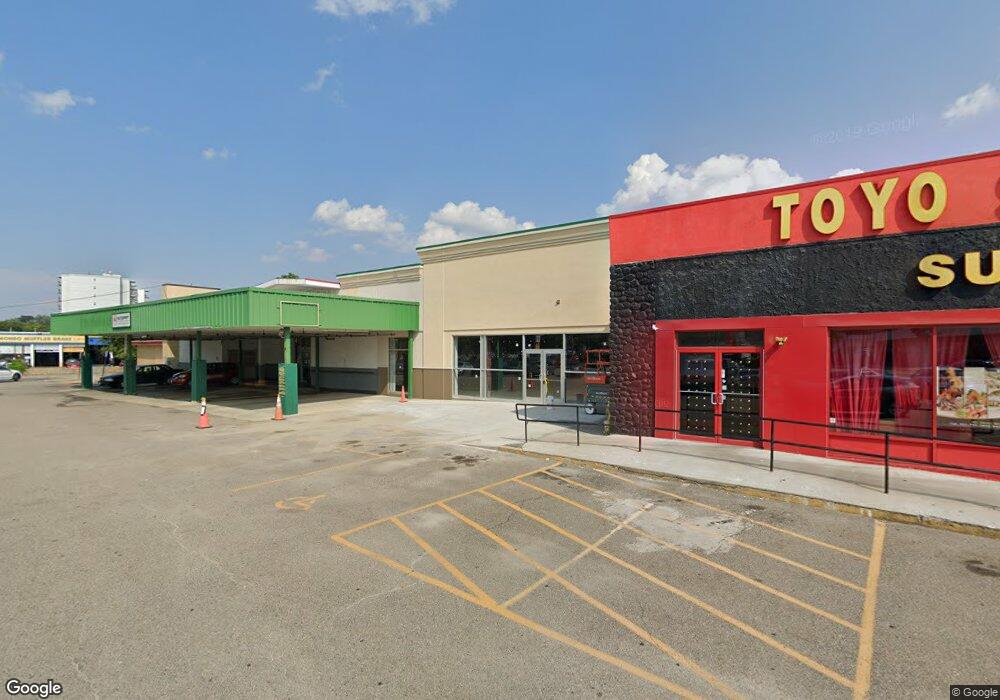
401 Clinton St Woonsocket, RI 02895
Social District Neighborhood
Studio
--
Bath
35,538
Sq Ft
162,479
Sq Ft
About This Home
This home is located at 401 Clinton St, Woonsocket, RI 02895. 401 Clinton St is a home located in Providence County with nearby schools including Woonsocket High School, Rise Prep Mayoral Academy Middle School, and Rise Prep Mayoral Academy.
Ownership History
Date
Name
Owned For
Owner Type
Purchase Details
Closed on
Jul 1, 2015
Sold by
Zhang Jun Y and Zhang Jun J
Bought by
401 Clinton St Llc
Purchase Details
Closed on
Feb 4, 2000
Sold by
Perkins Edward H and Perkins Cheryl A
Bought by
Zhang Jun Yong and Zhang Jun Jiang
Purchase Details
Closed on
Oct 16, 1996
Sold by
J & R Investment Inc
Bought by
Perkins Edward H and Perkins Cheryl
Purchase Details
Closed on
Dec 30, 1993
Sold by
Jennings Tr Adison L
Bought by
J & R Investment Inc
Create a Home Valuation Report for This Property
The Home Valuation Report is an in-depth analysis detailing your home's value as well as a comparison with similar homes in the area
Home Values in the Area
Average Home Value in this Area
Purchase History
| Date | Buyer | Sale Price | Title Company |
|---|---|---|---|
| 401 Clinton St Llc | $300,000 | -- | |
| 401 Clinton St Llc | $300,000 | -- | |
| Zhang Jun Yong | $600,000 | -- | |
| Zhang Jun Yong | $600,000 | -- | |
| Perkins Edward H | $550,000 | -- | |
| Perkins Edward H | $550,000 | -- | |
| J & R Investment Inc | $525,000 | -- | |
| J & R Investment Inc | $525,000 | -- |
Source: Public Records
Mortgage History
| Date | Status | Borrower | Loan Amount |
|---|---|---|---|
| Previous Owner | J & R Investment Inc | $950,000 | |
| Previous Owner | J & R Investment Inc | $510,000 |
Source: Public Records
Tax History
| Year | Tax Paid | Tax Assessment Tax Assessment Total Assessment is a certain percentage of the fair market value that is determined by local assessors to be the total taxable value of land and additions on the property. | Land | Improvement |
|---|---|---|---|---|
| 2025 | $41,032 | $1,926,400 | $485,000 | $1,441,400 |
| 2024 | $46,608 | $1,727,500 | $404,200 | $1,323,300 |
| 2023 | $44,811 | $1,727,500 | $404,200 | $1,323,300 |
| 2022 | $44,811 | $1,727,500 | $404,200 | $1,323,300 |
| 2021 | $54,081 | $1,556,300 | $305,400 | $1,250,900 |
| 2020 | $54,844 | $1,556,300 | $305,400 | $1,250,900 |
| 2018 | $39,465 | $1,090,500 | $305,400 | $785,100 |
| 2017 | $39,039 | $1,057,100 | $318,000 | $739,100 |
| 2016 | $40,529 | $1,057,100 | $318,000 | $739,100 |
| 2015 | $43,024 | $1,057,100 | $318,000 | $739,100 |
| 2014 | -- | $1,012,700 | $352,500 | $660,200 |
Source: Public Records
Map
Nearby Homes
- 70 W Park Place
- 18 Villa Nova St
- 60 Rathbun St
- 42 Elbow St
- 0 N Main St Unit 1401765
- 35 Greene St
- 142 Brook St
- 263 Elm St
- 346 Carrington Ave
- 271 Elm St
- 685 Social St Unit 308
- 685 Social St Unit 211
- 685 Social St Unit 115
- 345 Carrington Ave
- 410 Carrington Ave
- 180 Allen St Unit 104
- 311 Elm St
- 752 Social St
- 74 Maple St
- 130 E School St
Your Personal Tour Guide
Ask me questions while you tour the home.