Estimated Value: $402,840 - $460,000
3
Beds
3
Baths
2,016
Sq Ft
$211/Sq Ft
Est. Value
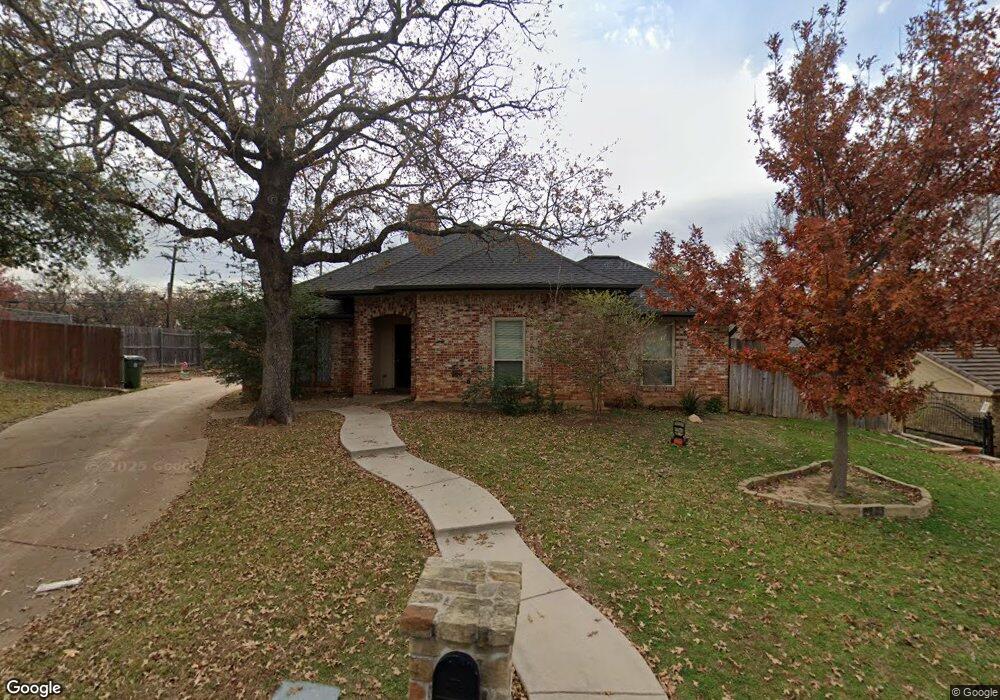
About This Home
This home is located at 401 Cumberland Dr, Hurst, TX 76054 and is currently estimated at $425,210, approximately $210 per square foot. 401 Cumberland Dr is a home located in Tarrant County with nearby schools including Shady Oaks Elementary School, Bedford Junior High School, and L.D. Bell High School.
Ownership History
Date
Name
Owned For
Owner Type
Purchase Details
Closed on
Mar 7, 2019
Sold by
Addington Brandon and Addington Brittany
Bought by
Smee Estefania and Smee Gavin
Current Estimated Value
Home Financials for this Owner
Home Financials are based on the most recent Mortgage that was taken out on this home.
Original Mortgage
$279,845
Outstanding Balance
$246,031
Interest Rate
4.4%
Mortgage Type
Purchase Money Mortgage
Estimated Equity
$179,179
Purchase Details
Closed on
Apr 9, 2012
Sold by
Tuerina Alda Noella Acevedo
Bought by
Addington Brandon and Hinkle Brittany
Home Financials for this Owner
Home Financials are based on the most recent Mortgage that was taken out on this home.
Original Mortgage
$133,527
Interest Rate
3.75%
Mortgage Type
FHA
Create a Home Valuation Report for This Property
The Home Valuation Report is an in-depth analysis detailing your home's value as well as a comparison with similar homes in the area
Home Values in the Area
Average Home Value in this Area
Purchase History
| Date | Buyer | Sale Price | Title Company |
|---|---|---|---|
| Smee Estefania | -- | Texas Secure Title Company | |
| Addington Brandon | -- | Hxf-Fatco |
Source: Public Records
Mortgage History
| Date | Status | Borrower | Loan Amount |
|---|---|---|---|
| Open | Smee Estefania | $279,845 | |
| Previous Owner | Addington Brandon | $133,527 |
Source: Public Records
Tax History Compared to Growth
Tax History
| Year | Tax Paid | Tax Assessment Tax Assessment Total Assessment is a certain percentage of the fair market value that is determined by local assessors to be the total taxable value of land and additions on the property. | Land | Improvement |
|---|---|---|---|---|
| 2025 | $7,497 | $322,740 | $75,000 | $247,740 |
| 2024 | $7,497 | $367,067 | $75,000 | $292,067 |
| 2023 | $7,432 | $370,955 | $55,000 | $315,955 |
| 2022 | $7,550 | $327,901 | $55,000 | $272,901 |
| 2021 | $7,086 | $293,791 | $55,000 | $238,791 |
| 2020 | $6,439 | $267,639 | $55,000 | $212,639 |
| 2019 | $5,940 | $279,204 | $55,000 | $224,204 |
| 2018 | $4,762 | $220,640 | $55,000 | $165,640 |
| 2017 | $5,076 | $215,714 | $18,000 | $197,714 |
| 2016 | $4,614 | $202,580 | $18,000 | $184,580 |
| 2015 | $3,494 | $171,900 | $18,000 | $153,900 |
| 2014 | $3,494 | $171,900 | $18,000 | $153,900 |
Source: Public Records
Map
Nearby Homes
- 404 Heather Ln
- 2244 Hurstview Dr
- 2212 Hurstview Dr
- 2620 Brookridge Dr
- 3713 Brentwood Ct
- 2668 Bent Tree Dr
- 421 Cavender Ct
- 305 Warbler Dr
- 2732 Woodbridge Dr
- 712 Springwood Dr
- 320 Blue Quail Ct
- 405 Woodbriar Ct
- 2804 Ridgewood Dr
- 712 Springhill Dr
- 736 Springhill Dr
- 2844 Hurstview Dr
- 432 Sunnybrook Ct
- 2809 Sandstone Dr
- 2908 Steve Dr
- 6521 Rock Springs Dr
- 405 Cumberland Dr
- 400 Stonehenge Dr
- 404 Stonehenge Dr
- 409 Cumberland Dr
- 2421 Norwood Dr
- 404 Cumberland Dr
- 408 Stonehenge Dr
- 408 Cumberland Dr
- 413 Cumberland Dr
- 412 Stonehenge Dr
- 401 Stonehenge Dr
- 405 Stonehenge Dr
- 412 Cumberland Dr
- 409 Stonehenge Dr
- 417 Cumberland Dr
- 416 Stonehenge Dr
- 2501 Norwood Dr
- 413 Stonehenge Dr
- 500 Cumberland Dr
- 505 Cumberland Dr