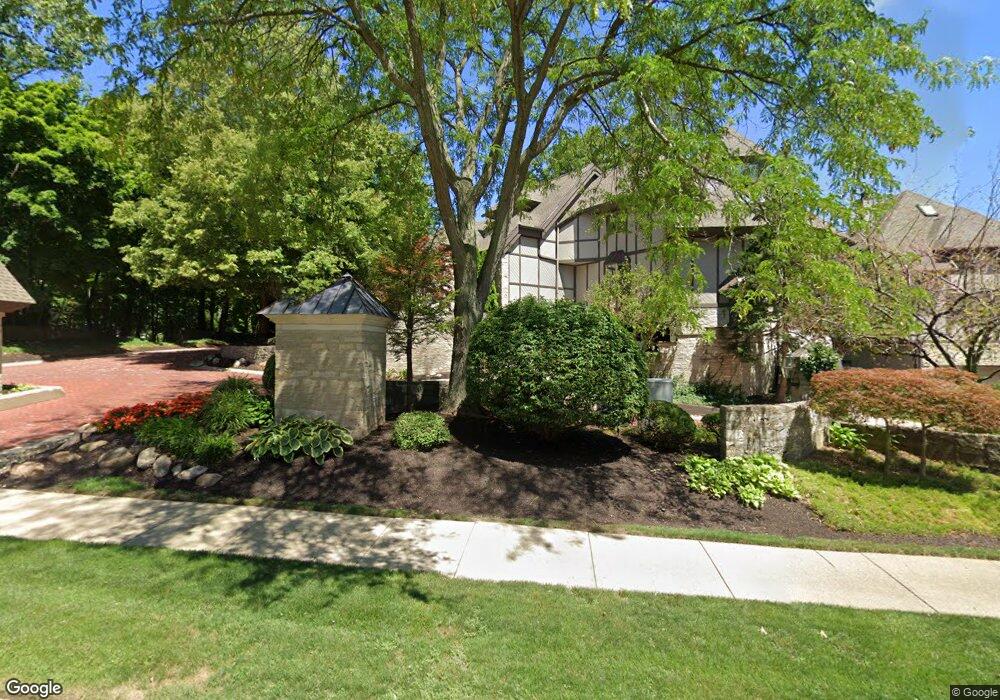
401 Darbys Run Unit 26 Bay Village, OH 44140
Estimated Value: $452,000 - $710,439
3
Beds
4
Baths
3,337
Sq Ft
$173/Sq Ft
Est. Value
About This Home
This home is located at 401 Darbys Run Unit 26, Bay Village, OH 44140 and is currently estimated at $576,110, approximately $172 per square foot. 401 Darbys Run Unit 26 is a home located in Cuyahoga County with nearby schools including Normandy Elementary School, Westerly Elementary School, and Bay Middle School.
Ownership History
Date
Name
Owned For
Owner Type
Purchase Details
Closed on
Jul 14, 2010
Sold by
Mcdonough Antoinette
Bought by
Kinter Linda and 401 Darbys Run Trust
Current Estimated Value
Purchase Details
Closed on
Nov 25, 2009
Sold by
Mcdonough Antoinette
Bought by
Mcdonough Antoinette and Antoinette Mcdonough Trust
Purchase Details
Closed on
Dec 14, 2004
Sold by
Brookins Gary and Brookins Rosalie G
Bought by
Mcdonough Antoinette
Home Financials for this Owner
Home Financials are based on the most recent Mortgage that was taken out on this home.
Original Mortgage
$250,000
Interest Rate
5.77%
Mortgage Type
Unknown
Purchase Details
Closed on
Jun 5, 1990
Sold by
Tabern Tabern G G and Tabern Katherine
Bought by
Brookins Gary
Purchase Details
Closed on
Jan 1, 1983
Bought by
Tabern Tabern G and Tabern Katherine
Create a Home Valuation Report for This Property
The Home Valuation Report is an in-depth analysis detailing your home's value as well as a comparison with similar homes in the area
Home Values in the Area
Average Home Value in this Area
Purchase History
| Date | Buyer | Sale Price | Title Company |
|---|---|---|---|
| Kinter Linda | $353,000 | Northstar Title Agency | |
| Mcdonough Antoinette | -- | Attorney | |
| Mcdonough Antoinette | $360,000 | Real Living Title Agency L | |
| Brookins Gary | $300,000 | -- | |
| Tabern Tabern G | -- | -- |
Source: Public Records
Mortgage History
| Date | Status | Borrower | Loan Amount |
|---|---|---|---|
| Previous Owner | Mcdonough Antoinette | $250,000 |
Source: Public Records
Tax History Compared to Growth
Tax History
| Year | Tax Paid | Tax Assessment Tax Assessment Total Assessment is a certain percentage of the fair market value that is determined by local assessors to be the total taxable value of land and additions on the property. | Land | Improvement |
|---|---|---|---|---|
| 2024 | $12,664 | $186,865 | $18,690 | $168,175 |
| 2023 | $14,011 | $175,140 | $16,590 | $158,550 |
| 2022 | $14,074 | $175,140 | $16,590 | $158,550 |
| 2021 | $12,637 | $175,140 | $16,590 | $158,550 |
| 2020 | $12,660 | $157,780 | $14,950 | $142,840 |
| 2019 | $12,292 | $450,800 | $42,700 | $408,100 |
| 2018 | $11,542 | $157,780 | $14,950 | $142,840 |
| 2017 | $11,629 | $135,910 | $14,950 | $120,960 |
| 2016 | $11,581 | $135,910 | $14,950 | $120,960 |
| 2015 | $10,222 | $135,910 | $14,950 | $120,960 |
| 2014 | $10,222 | $123,550 | $13,580 | $109,970 |
Source: Public Records
Map
Nearby Homes
- 23200 Lake Rd Unit 50
- 23200 Lake Rd Unit 47
- 23200 Lake Rd Unit 30
- 421 Darbys Run
- 22722 Lake Rd
- 22728 Lake Rd
- 22700 Lake Rd Unit 204
- 22700 Lake Rd Unit 305
- 22700 Lake Rd Unit 406
- 22700 Lake Rd Unit 306
- 22700 Lake Rd Unit 405
- 22700 Lake Rd Unit 304
- 22700 Lake Rd Unit 504
- 22700 Lake Rd Unit 102
- 7 Pond Dr
- 22500 Lake Rd Unit 202
- 22480 Lake Rd Unit 9
- 24014 Wolf Rd
- 700 Brick Mill Run Unit 406
- 561 Upland Rd
- 441 Darbys Run Unit 14
- 430 Darbys Run Unit 13
- 371 Darbys Run Unit 23
- 431 Darbys Run Unit 16
- 450 Darbys Run Unit R19
- 341 Darbys Run
- 361 Darbys Run
- 410 Darbys Run
- 444 Darbys Run
- 390 Darbys Run
- 390 Darbys Run Unit 9
- 444 Darbys Run Unit 20
- 410 Darbys Run Unit 11
- 440 Darby's Run
- 420 Darbys Run
- 400 Darbys Run
- 420 Darbys Run Unit 12
- 400 Darbys Run Unit 10
- 410 Darby's Run
- 391 Darbys Run Unit 25