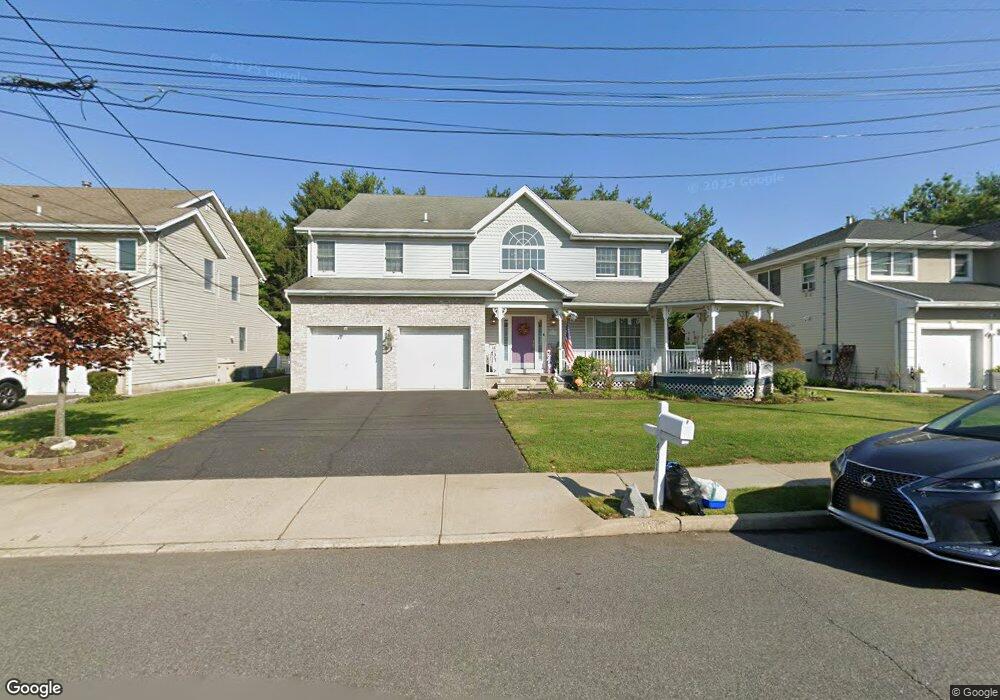
401 Dewey Ave Saddle Brook, NJ 07663
Estimated Value: $899,334 - $1,123,000
--
Bed
--
Bath
3,415
Sq Ft
$297/Sq Ft
Est. Value
About This Home
This home is located at 401 Dewey Ave, Saddle Brook, NJ 07663 and is currently estimated at $1,014,584, approximately $297 per square foot. 401 Dewey Ave is a home located in Bergen County with nearby schools including Saddle Brook Mid High School and St. Leo Elementary School.
Ownership History
Date
Name
Owned For
Owner Type
Purchase Details
Closed on
May 28, 2015
Sold by
Stuckey Mary
Bought by
Shapiro Philip and Shapiro Brenda
Current Estimated Value
Home Financials for this Owner
Home Financials are based on the most recent Mortgage that was taken out on this home.
Original Mortgage
$140,000
Interest Rate
3.65%
Mortgage Type
New Conventional
Purchase Details
Closed on
Mar 19, 2014
Sold by
Stucker Mary
Bought by
Stuckey Mary
Purchase Details
Closed on
Dec 28, 2006
Sold by
Buesing Joseph
Bought by
Stuckey Mary and Stuckey Edwarc
Home Financials for this Owner
Home Financials are based on the most recent Mortgage that was taken out on this home.
Original Mortgage
$300,000
Interest Rate
6.18%
Mortgage Type
Purchase Money Mortgage
Purchase Details
Closed on
Aug 31, 1998
Sold by
Hrubec Robert J and Hrubec Thomas J
Bought by
Buesing Joseph and Buesing Paula
Home Financials for this Owner
Home Financials are based on the most recent Mortgage that was taken out on this home.
Original Mortgage
$275,000
Interest Rate
6.9%
Create a Home Valuation Report for This Property
The Home Valuation Report is an in-depth analysis detailing your home's value as well as a comparison with similar homes in the area
Home Values in the Area
Average Home Value in this Area
Purchase History
| Date | Buyer | Sale Price | Title Company |
|---|---|---|---|
| Shapiro Philip | $645,000 | Attorney | |
| Stuckey Mary | -- | -- | |
| Stuckey Mary | $789,000 | -- | |
| Buesing Joseph | $350,000 | -- |
Source: Public Records
Mortgage History
| Date | Status | Borrower | Loan Amount |
|---|---|---|---|
| Closed | Shapiro Philip | $140,000 | |
| Previous Owner | Stuckey Mary | $300,000 | |
| Previous Owner | Buesing Joseph | $275,000 |
Source: Public Records
Tax History Compared to Growth
Tax History
| Year | Tax Paid | Tax Assessment Tax Assessment Total Assessment is a certain percentage of the fair market value that is determined by local assessors to be the total taxable value of land and additions on the property. | Land | Improvement |
|---|---|---|---|---|
| 2025 | $17,147 | $764,300 | $247,100 | $517,200 |
| 2024 | $15,231 | $743,600 | $242,600 | $501,000 |
| 2023 | $14,431 | $652,000 | $213,600 | $438,400 |
| 2022 | $14,431 | $600,800 | $202,100 | $398,700 |
| 2021 | $14,431 | $554,200 | $179,600 | $374,600 |
| 2020 | $13,872 | $538,700 | $176,100 | $362,600 |
| 2019 | $13,836 | $533,600 | $174,100 | $359,500 |
| 2018 | $13,489 | $531,700 | $174,600 | $357,100 |
| 2017 | $13,555 | $525,800 | $172,100 | $353,700 |
| 2016 | $13,892 | $484,900 | $162,100 | $322,800 |
| 2015 | $12,915 | $484,900 | $162,100 | $322,800 |
| 2014 | -- | $484,900 | $162,100 | $322,800 |
Source: Public Records
Map
Nearby Homes
- 16 Sherry Ln Unit 38
- 39 Sampson St
- 484 Sylvan St
- 502 Sylvan St
- 407 van Luyn Terrace
- 501 Victor St
- 520 Victor St Unit 49
- 520 Victor St Unit 29
- 23 Liberty St
- 138 N 5th St
- 485 Saddle River Rd Unit 13
- 485 Saddle River Rd Unit 1
- 54 Rochelle Pkwy
- 12 Streuli Ct
- 280 South Blvd
- 466 Market St Unit 468
- 132 Cory Ln Unit C0132
- 68 Miller St
- 21 Kuhn Ct
- 259 Cory Ln