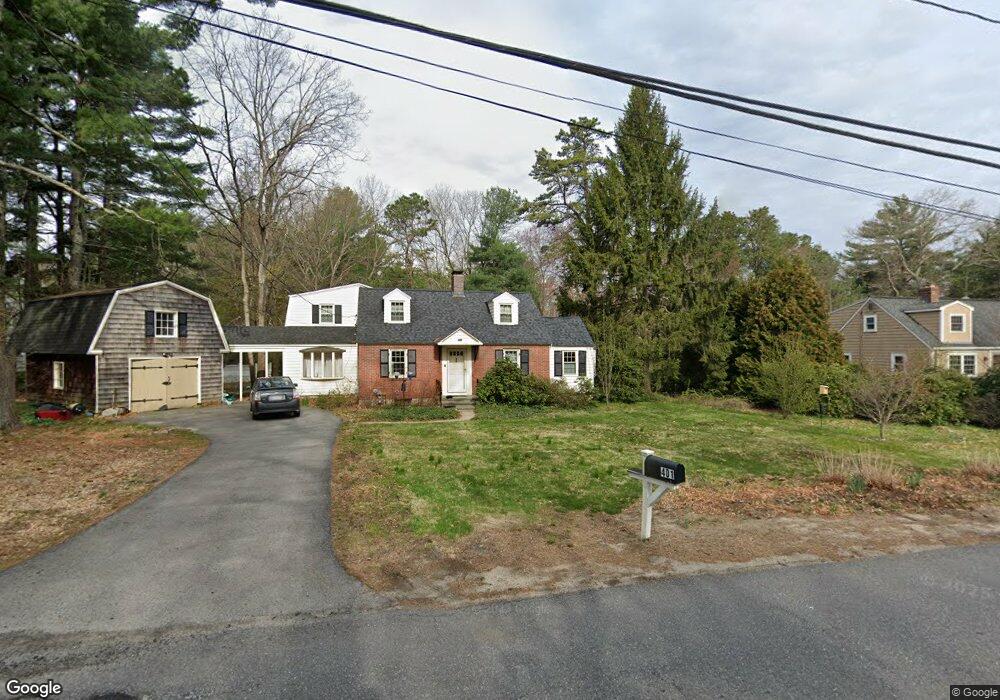
401 Dutton Rd Sudbury, MA 01776
Estimated Value: $819,292 - $895,000
3
Beds
3
Baths
2,065
Sq Ft
$415/Sq Ft
Est. Value
About This Home
This home is located at 401 Dutton Rd, Sudbury, MA 01776 and is currently estimated at $857,573, approximately $415 per square foot. 401 Dutton Rd is a home located in Middlesex County with nearby schools including Peter Noyes Elementary School, Ephraim Curtis Middle School, and Lincoln-Sudbury Regional High School.
Ownership History
Date
Name
Owned For
Owner Type
Purchase Details
Closed on
Jun 29, 2010
Sold by
Smith Mary B
Bought by
Rigg Marjorie
Current Estimated Value
Home Financials for this Owner
Home Financials are based on the most recent Mortgage that was taken out on this home.
Original Mortgage
$220,000
Outstanding Balance
$146,951
Interest Rate
4.98%
Mortgage Type
Purchase Money Mortgage
Estimated Equity
$710,622
Create a Home Valuation Report for This Property
The Home Valuation Report is an in-depth analysis detailing your home's value as well as a comparison with similar homes in the area
Home Values in the Area
Average Home Value in this Area
Purchase History
| Date | Buyer | Sale Price | Title Company |
|---|---|---|---|
| Rigg Marjorie | $390,500 | -- |
Source: Public Records
Mortgage History
| Date | Status | Borrower | Loan Amount |
|---|---|---|---|
| Open | Rigg Marjorie | $220,000 |
Source: Public Records
Tax History
| Year | Tax Paid | Tax Assessment Tax Assessment Total Assessment is a certain percentage of the fair market value that is determined by local assessors to be the total taxable value of land and additions on the property. | Land | Improvement |
|---|---|---|---|---|
| 2025 | $9,864 | $673,800 | $388,000 | $285,800 |
| 2024 | $9,530 | $652,300 | $376,600 | $275,700 |
| 2023 | $9,628 | $610,500 | $342,300 | $268,200 |
| 2022 | $9,381 | $519,700 | $314,200 | $205,500 |
| 2021 | $9,131 | $484,900 | $314,200 | $170,700 |
| 2020 | $8,946 | $484,900 | $314,200 | $170,700 |
| 2019 | $8,685 | $484,900 | $314,200 | $170,700 |
| 2018 | $8,562 | $477,500 | $317,800 | $159,700 |
| 2017 | $8,109 | $457,100 | $306,900 | $150,200 |
| 2016 | $7,816 | $439,100 | $295,200 | $143,900 |
| 2015 | $7,455 | $423,600 | $281,300 | $142,300 |
| 2014 | $7,401 | $410,500 | $271,400 | $139,100 |
Source: Public Records
Map
Nearby Homes
- 53 Pine St
- 30 Kendall Rd
- 557 Dutton Rd Unit 2
- 30 Rolling Ln
- 11 Great Lake Dr
- 15 Harness Ln
- 30 Harness Ln
- 62 Churchill St
- 0 Robbins Rd
- 11 October Rd
- 0 Boston Post Rd
- 22 Barracks Rd Unit 22
- 15 Huckleberry Ln
- 45 Webster Cir
- 11 Farmstead Ln Unit 11
- 788 Main St
- 55 Widow Rites Ln
- 45 Widow Rites Ln
- 786 Main St
- 1011 Boston Post Rd
Your Personal Tour Guide
Ask me questions while you tour the home.