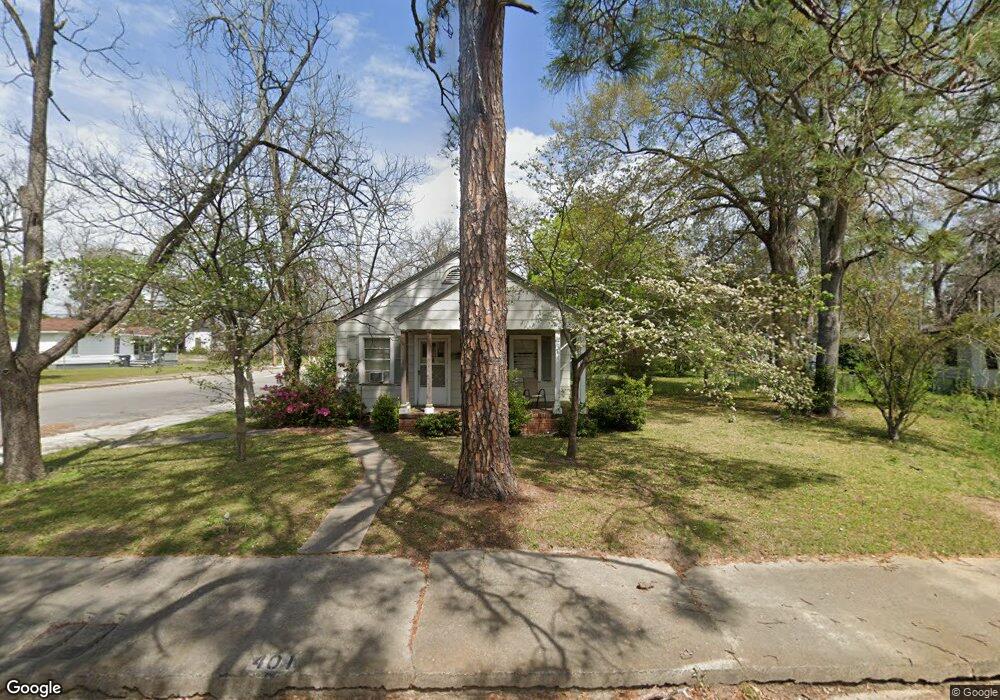
401 E 14th Ave Cordele, GA 31015
Estimated Value: $58,858 - $89,000
2
Beds
1
Bath
810
Sq Ft
$90/Sq Ft
Est. Value
About This Home
This home is located at 401 E 14th Ave, Cordele, GA 31015 and is currently estimated at $72,965, approximately $90 per square foot. 401 E 14th Ave is a home located in Crisp County with nearby schools including Crisp County Elementary School, Crisp County Primary School, and Crisp County Middle School.
Ownership History
Date
Name
Owned For
Owner Type
Purchase Details
Closed on
Feb 9, 2012
Bought by
Daniels Thad
Current Estimated Value
Home Financials for this Owner
Home Financials are based on the most recent Mortgage that was taken out on this home.
Original Mortgage
$18,111
Outstanding Balance
$12,330
Interest Rate
3.91%
Mortgage Type
New Conventional
Estimated Equity
$60,635
Purchase Details
Closed on
Sep 6, 2011
Sold by
Coastal States Mortgage Corpor
Bought by
Federal Home Loan Mortgage Corporation
Purchase Details
Closed on
Jun 16, 2000
Sold by
Porter Mary E H
Bought by
Taylor Marshall D
Purchase Details
Closed on
Sep 24, 1993
Sold by
Porter Heyward Etal
Bought by
Porter Mary E H
Purchase Details
Closed on
Jan 25, 1971
Bought by
Porter Heyward Etal
Create a Home Valuation Report for This Property
The Home Valuation Report is an in-depth analysis detailing your home's value as well as a comparison with similar homes in the area
Purchase History
| Date | Buyer | Sale Price | Title Company |
|---|---|---|---|
| Daniels Thad | $18,111 | -- | |
| Daniels Thad | $18,111 | -- | |
| Federal Home Loan Mortgage Corporation | $25,000 | -- | |
| Taylor Marshall D | $42,000 | -- | |
| Porter Mary E H | -- | -- | |
| Porter Heyward Etal | -- | -- |
Source: Public Records
Mortgage History
| Date | Status | Borrower | Loan Amount |
|---|---|---|---|
| Open | Daniels Thad | $18,111 | |
| Closed | Daniels Thad | $18,111 |
Source: Public Records
Tax History
| Year | Tax Paid | Tax Assessment Tax Assessment Total Assessment is a certain percentage of the fair market value that is determined by local assessors to be the total taxable value of land and additions on the property. | Land | Improvement |
|---|---|---|---|---|
| 2025 | $581 | $16,459 | $3,000 | $13,459 |
| 2024 | $545 | $15,200 | $3,000 | $12,200 |
| 2023 | $546 | $14,570 | $3,000 | $11,570 |
| 2022 | $368 | $13,940 | $3,000 | $10,940 |
| 2021 | $361 | $13,310 | $3,000 | $10,310 |
| 2020 | $375 | $13,310 | $3,000 | $10,310 |
| 2019 | $377 | $13,310 | $3,000 | $10,310 |
| 2018 | $298 | $10,116 | $3,000 | $7,116 |
| 2017 | $410 | $10,092 | $3,000 | $7,092 |
| 2016 | $298 | $10,092 | $3,000 | $7,092 |
| 2015 | -- | $10,092 | $3,000 | $7,092 |
| 2014 | -- | $10,092 | $3,000 | $7,092 |
| 2013 | -- | $10,092 | $3,000 | $7,092 |
Source: Public Records
Map
Nearby Homes
Your Personal Tour Guide
Ask me questions while you tour the home.