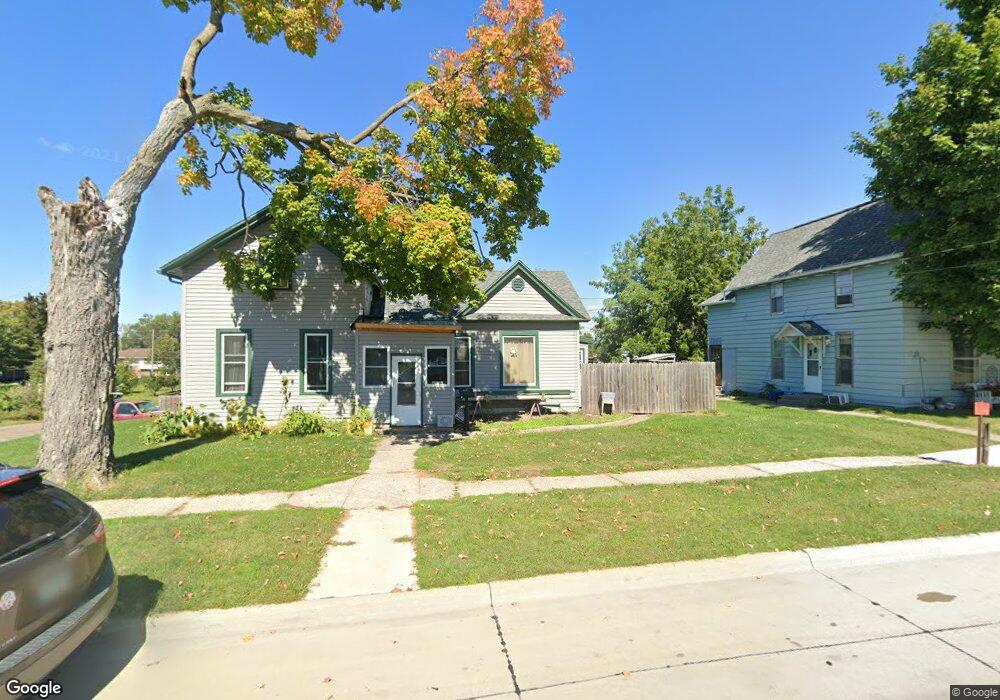
401 E 3rd St Vinton, IA 52349
Estimated Value: $133,806 - $147,000
3
Beds
1
Bath
1,560
Sq Ft
$91/Sq Ft
Est. Value
About This Home
This home is located at 401 E 3rd St, Vinton, IA 52349 and is currently estimated at $141,952, approximately $90 per square foot. 401 E 3rd St is a home located in Benton County with nearby schools including Tilford Elementary School, Vinton-Shellsburg Middle School, and Vinton-Shellsburg High School.
Ownership History
Date
Name
Owned For
Owner Type
Purchase Details
Closed on
May 30, 2014
Sold by
Stephens Jarrell D
Bought by
Davidson Ann L
Current Estimated Value
Home Financials for this Owner
Home Financials are based on the most recent Mortgage that was taken out on this home.
Original Mortgage
$7,000
Interest Rate
4.28%
Mortgage Type
Stand Alone Second
Create a Home Valuation Report for This Property
The Home Valuation Report is an in-depth analysis detailing your home's value as well as a comparison with similar homes in the area
Home Values in the Area
Average Home Value in this Area
Purchase History
| Date | Buyer | Sale Price | Title Company |
|---|---|---|---|
| Davidson Ann L | $70,000 | None Available |
Source: Public Records
Mortgage History
| Date | Status | Borrower | Loan Amount |
|---|---|---|---|
| Closed | Davidson Ann L | $7,000 |
Source: Public Records
Tax History
| Year | Tax Paid | Tax Assessment Tax Assessment Total Assessment is a certain percentage of the fair market value that is determined by local assessors to be the total taxable value of land and additions on the property. | Land | Improvement |
|---|---|---|---|---|
| 2025 | $1,918 | $124,800 | $17,900 | $106,900 |
| 2024 | $1,918 | $112,600 | $17,200 | $95,400 |
| 2023 | $1,794 | $112,600 | $17,200 | $95,400 |
| 2022 | $1,838 | $92,200 | $13,700 | $78,500 |
| 2021 | $1,838 | $92,200 | $13,700 | $78,500 |
| 2020 | $1,374 | $72,300 | $11,400 | $60,900 |
| 2019 | $1,482 | $72,300 | $11,400 | $60,900 |
| 2018 | $1,434 | $76,100 | $10,600 | $65,500 |
| 2017 | $1,434 | $76,100 | $10,600 | $65,500 |
| 2016 | $1,346 | $71,100 | $9,900 | $61,200 |
| 2015 | $1,346 | $71,100 | $9,900 | $61,200 |
| 2014 | $1,280 | $67,900 | $0 | $0 |
Source: Public Records
Map
Nearby Homes
Your Personal Tour Guide
Ask me questions while you tour the home.