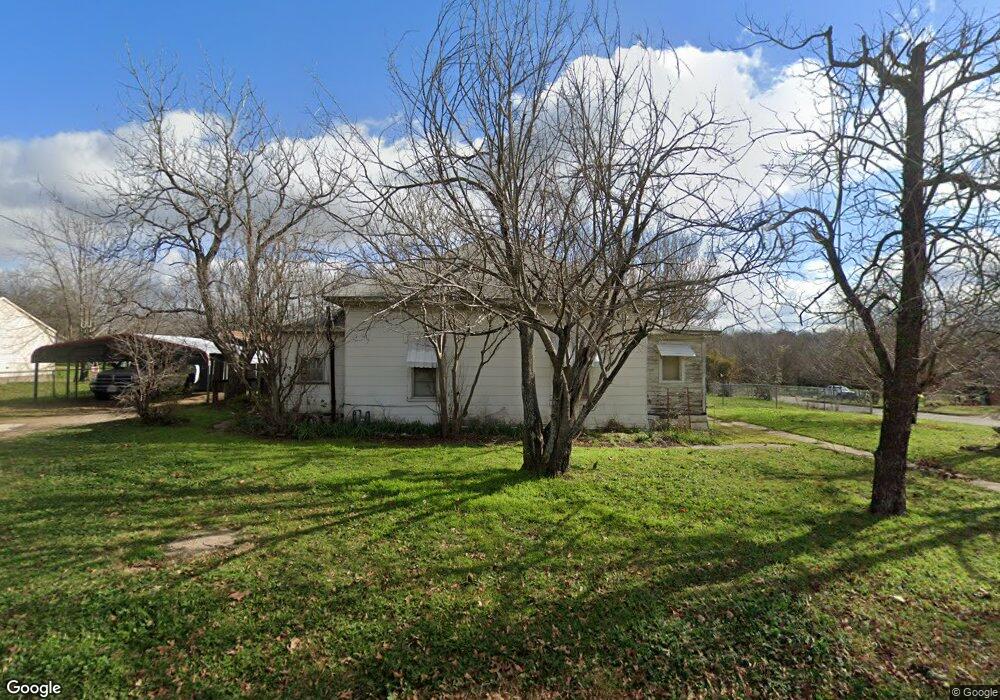
401 E 3rd St Weatherford, TX 76086
Estimated Value: $250,707 - $290,000
--
Bed
--
Bath
1,549
Sq Ft
$177/Sq Ft
Est. Value
About This Home
This home is located at 401 E 3rd St, Weatherford, TX 76086 and is currently estimated at $273,677, approximately $176 per square foot. 401 E 3rd St is a home located in Parker County with nearby schools including Seguin Elementary School, Tison Middle School, and Weatherford High School.
Ownership History
Date
Name
Owned For
Owner Type
Purchase Details
Closed on
Jun 7, 2006
Sold by
Gibbs Tommy D
Bought by
Tinsley Ii Bobby D and Tinsley Charlotte A
Current Estimated Value
Home Financials for this Owner
Home Financials are based on the most recent Mortgage that was taken out on this home.
Original Mortgage
$55,000
Interest Rate
6.21%
Mortgage Type
Seller Take Back
Purchase Details
Closed on
May 23, 2006
Sold by
Smith Kathy
Bought by
Gibbs Tommy D
Home Financials for this Owner
Home Financials are based on the most recent Mortgage that was taken out on this home.
Original Mortgage
$55,000
Interest Rate
6.21%
Mortgage Type
Seller Take Back
Purchase Details
Closed on
May 5, 1993
Sold by
West Mark Bruce and Buchner Barbara A
Bought by
Tinsley Bobby D and Tinsley Charlotte A
Purchase Details
Closed on
Nov 21, 1989
Sold by
Gibbs Tommy D and Gibbs Lois F
Bought by
Tinsley Bobby D and Tinsley Charlotte A
Create a Home Valuation Report for This Property
The Home Valuation Report is an in-depth analysis detailing your home's value as well as a comparison with similar homes in the area
Home Values in the Area
Average Home Value in this Area
Purchase History
| Date | Buyer | Sale Price | Title Company |
|---|---|---|---|
| Tinsley Ii Bobby D | -- | Fato | |
| Gibbs Tommy D | -- | Fatco | |
| Tinsley Bobby D | -- | -- | |
| Tinsley Bobby D | -- | -- |
Source: Public Records
Mortgage History
| Date | Status | Borrower | Loan Amount |
|---|---|---|---|
| Closed | Tinsley Ii Bobby D | $55,000 |
Source: Public Records
Tax History Compared to Growth
Tax History
| Year | Tax Paid | Tax Assessment Tax Assessment Total Assessment is a certain percentage of the fair market value that is determined by local assessors to be the total taxable value of land and additions on the property. | Land | Improvement |
|---|---|---|---|---|
| 2025 | $579 | $155,969 | -- | -- |
| 2024 | $579 | $141,790 | -- | -- |
| 2023 | $579 | $128,900 | $0 | $0 |
| 2022 | $2,599 | $117,190 | $15,000 | $102,190 |
| 2021 | $2,716 | $117,190 | $15,000 | $102,190 |
| 2020 | $2,485 | $102,830 | $15,000 | $87,830 |
| 2019 | $2,520 | $102,830 | $15,000 | $87,830 |
| 2018 | $2,301 | $89,700 | $15,000 | $74,700 |
| 2017 | $2,200 | $89,700 | $15,000 | $74,700 |
| 2016 | $2,000 | $76,000 | $15,000 | $61,000 |
| 2015 | $997 | $76,000 | $15,000 | $61,000 |
| 2014 | $1,123 | $69,340 | $15,000 | $54,340 |
Source: Public Records
Map
Nearby Homes