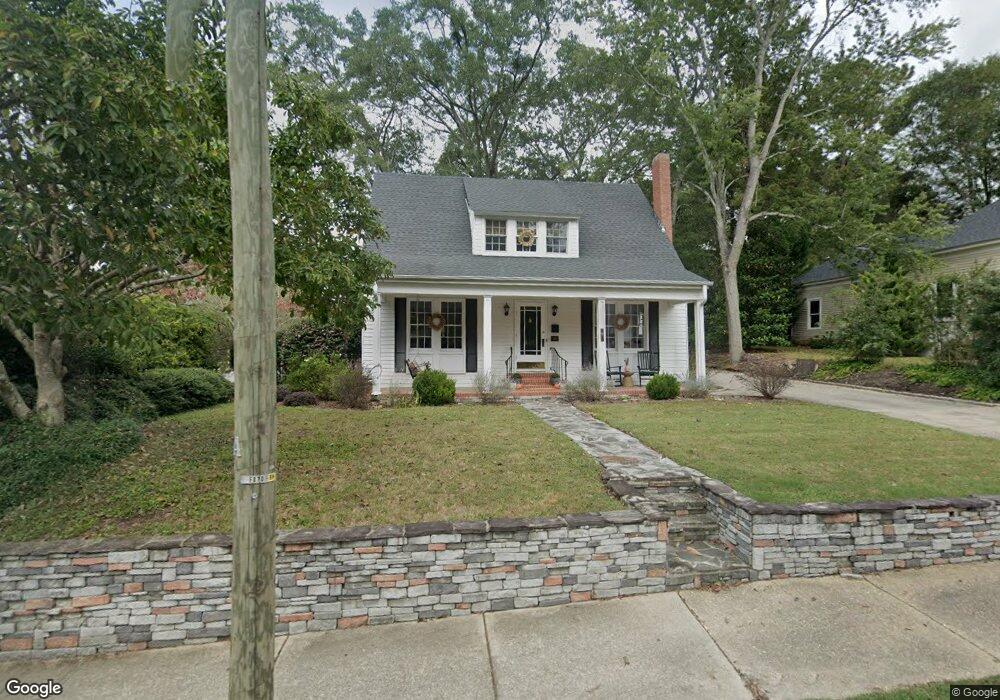
401 E Academy St Fuquay Varina, NC 27526
Estimated Value: $376,000 - $436,000
4
Beds
2
Baths
1,965
Sq Ft
$212/Sq Ft
Est. Value
About This Home
This home is located at 401 E Academy St, Fuquay Varina, NC 27526 and is currently estimated at $416,989, approximately $212 per square foot. 401 E Academy St is a home located in Wake County with nearby schools including Fuquay-Varina High, Achievement Charter Academy, and Southern Wake Academy.
Ownership History
Date
Name
Owned For
Owner Type
Purchase Details
Closed on
Nov 4, 2020
Sold by
Holm Michael M and Holm Natalie R
Bought by
Baumann Eric W and Baumann Alexandra L
Current Estimated Value
Home Financials for this Owner
Home Financials are based on the most recent Mortgage that was taken out on this home.
Original Mortgage
$228,000
Outstanding Balance
$202,888
Interest Rate
2.8%
Mortgage Type
New Conventional
Estimated Equity
$214,101
Purchase Details
Closed on
Aug 11, 2015
Sold by
Organ Mary Helen
Bought by
Holm Michael M and Holm Natlie R
Home Financials for this Owner
Home Financials are based on the most recent Mortgage that was taken out on this home.
Original Mortgage
$129,600
Interest Rate
4.16%
Mortgage Type
New Conventional
Purchase Details
Closed on
Oct 31, 2012
Bought by
Organ Mary Helen
Purchase Details
Closed on
Jan 28, 2001
Sold by
Hammond Mark E
Bought by
Meckes Brenda Pylant
Create a Home Valuation Report for This Property
The Home Valuation Report is an in-depth analysis detailing your home's value as well as a comparison with similar homes in the area
Home Values in the Area
Average Home Value in this Area
Purchase History
| Date | Buyer | Sale Price | Title Company |
|---|---|---|---|
| Baumann Eric W | $285,000 | None Available | |
| Holm Michael M | $144,000 | Attorney | |
| Organ Mary Helen | $150,000 | -- | |
| Meckes Brenda Pylant | $130,000 | -- |
Source: Public Records
Mortgage History
| Date | Status | Borrower | Loan Amount |
|---|---|---|---|
| Open | Baumann Eric W | $228,000 | |
| Previous Owner | Holm Michael M | $129,600 |
Source: Public Records
Tax History Compared to Growth
Tax History
| Year | Tax Paid | Tax Assessment Tax Assessment Total Assessment is a certain percentage of the fair market value that is determined by local assessors to be the total taxable value of land and additions on the property. | Land | Improvement |
|---|---|---|---|---|
| 2025 | $3,392 | $385,285 | $90,000 | $295,285 |
| 2024 | $3,378 | $385,285 | $90,000 | $295,285 |
| 2023 | $2,349 | $209,424 | $44,000 | $165,424 |
| 2022 | $2,207 | $209,424 | $44,000 | $165,424 |
| 2021 | $2,104 | $209,424 | $44,000 | $165,424 |
| 2020 | $2,104 | $209,424 | $44,000 | $165,424 |
| 2019 | $1,782 | $152,797 | $28,800 | $123,997 |
| 2018 | $1,681 | $152,797 | $28,800 | $123,997 |
| 2017 | $1,621 | $145,331 | $28,800 | $116,531 |
| 2016 | $1,521 | $145,331 | $28,800 | $116,531 |
| 2015 | $1,419 | $139,924 | $31,500 | $108,424 |
| 2014 | $1,367 | $139,924 | $31,500 | $108,424 |
Source: Public Records
Map
Nearby Homes
- 150 Rusling Leaf Dr
- 113 S Ennis St
- 138 Rusling Leaf Dr
- 201 S Ennis St
- 306 Country Side Way
- 318 Country Side Way
- 77 Saintsbury Dr
- 63 Saintsbury Dr
- 2200 Astride Way
- 511 Raleigh St
- 409 E Vance St
- 134 Rusling Leaf Dr
- 146 Rusling Leaf Dr
- 612 E Academy St
- 0 S Main St S Unit 10112239
- 130 Rusling Leaf Dr
- 501 E Spring St
- 142 Rusling Leaf Dr
- 121 N West St
- Pamlico Plan at Midtown Rows
- 405 E Academy St
- 108 East St
- 406 E Academy St
- 407 E Academy St
- 301 E Academy St
- 408 E Academy St
- 114 East St
- 111 N Woodrow St
- 302 E Academy St
- 113 N Woodrow St
- 104 S Woodrow St
- 111 S Aiken St
- 115 N Woodrow St
- 106 S Woodrow St
- 212 E Academy St
- 117 N Woodrow St
- 120 East St
- 504 E Academy St
- 117 East St
- 103 N Aiken St