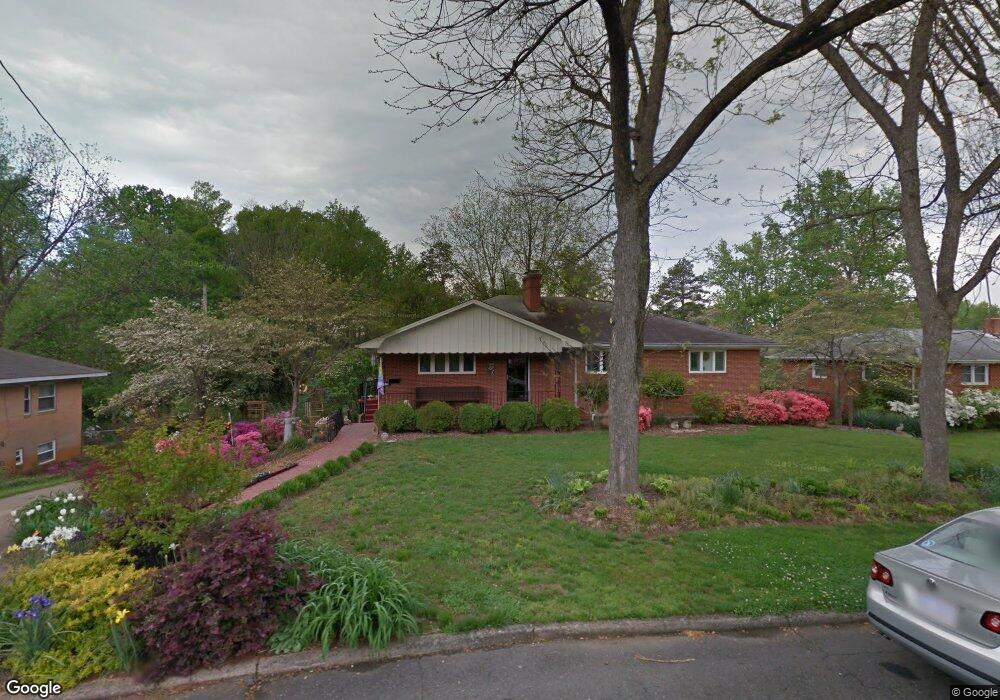
401 Edgewood Rd Shelby, NC 28150
Estimated Value: $304,000 - $429,000
--
Bed
--
Bath
2,840
Sq Ft
$122/Sq Ft
Est. Value
About This Home
This home is located at 401 Edgewood Rd, Shelby, NC 28150 and is currently estimated at $346,706, approximately $122 per square foot. 401 Edgewood Rd is a home located in Cleveland County with nearby schools including Graham Elementary School, Shelby Middle School, and Shelby High School.
Ownership History
Date
Name
Owned For
Owner Type
Purchase Details
Closed on
Dec 30, 2022
Sold by
Coulter Jamie Lee
Bought by
Coulter Jamie Lee
Current Estimated Value
Purchase Details
Closed on
Feb 4, 2010
Sold by
Coulter Jamie Lee and Coulter Dana Cordell
Bought by
Coulter Jamie Lee
Home Financials for this Owner
Home Financials are based on the most recent Mortgage that was taken out on this home.
Original Mortgage
$156,150
Interest Rate
5.12%
Mortgage Type
FHA
Purchase Details
Closed on
May 24, 2007
Sold by
Lang Ann Marie R and Lang Robert W
Bought by
Coulter Janie Lee and Coulter Dana Cordell
Home Financials for this Owner
Home Financials are based on the most recent Mortgage that was taken out on this home.
Original Mortgage
$42,100
Interest Rate
6.16%
Mortgage Type
Stand Alone Second
Create a Home Valuation Report for This Property
The Home Valuation Report is an in-depth analysis detailing your home's value as well as a comparison with similar homes in the area
Home Values in the Area
Average Home Value in this Area
Purchase History
| Date | Buyer | Sale Price | Title Company |
|---|---|---|---|
| Coulter Jamie Lee | -- | -- | |
| Coulter Jamie Lee | -- | None Available | |
| Coulter Janie Lee | $168,500 | None Available |
Source: Public Records
Mortgage History
| Date | Status | Borrower | Loan Amount |
|---|---|---|---|
| Previous Owner | Coulter Jamie Lee | $156,150 | |
| Previous Owner | Coulter Janie Lee | $42,100 | |
| Previous Owner | Coulter Janie Lee | $225,300 |
Source: Public Records
Tax History Compared to Growth
Tax History
| Year | Tax Paid | Tax Assessment Tax Assessment Total Assessment is a certain percentage of the fair market value that is determined by local assessors to be the total taxable value of land and additions on the property. | Land | Improvement |
|---|---|---|---|---|
| 2025 | $2,835 | $284,939 | $23,310 | $261,629 |
| 2024 | $2,390 | $196,269 | $20,535 | $175,734 |
| 2023 | $2,378 | $196,269 | $20,535 | $175,734 |
| 2022 | $2,378 | $196,269 | $20,535 | $175,734 |
| 2021 | $2,390 | $196,269 | $20,535 | $175,734 |
| 2020 | $1,672 | $132,828 | $20,535 | $112,293 |
| 2019 | $1,672 | $132,828 | $20,535 | $112,293 |
| 2018 | $1,671 | $132,828 | $20,535 | $112,293 |
| 2017 | $1,629 | $132,828 | $20,535 | $112,293 |
| 2016 | $1,635 | $132,828 | $20,535 | $112,293 |
| 2015 | $1,764 | $151,100 | $20,535 | $130,565 |
| 2014 | $1,764 | $151,100 | $20,535 | $130,565 |
Source: Public Records
Map
Nearby Homes
- 628 Westover Terrace
- 703 Westover Terrace
- 608 Hanover Dr
- 211 Worthington St
- 514 W Sumter St
- 724 W Warren St
- 910 W Sumter St
- 912 W Sumter St
- 914 W Sumter St
- 916 W Sumter St
- 601 W Marion St
- 615 W Warren St
- 219 Young St
- 725 W Graham St
- 912 W Marion St
- 415 W Warren St
- 327 Woodside Dr
- 311 Best St
- 728 Blanton St
- 417 W Graham St
- 307 Edgewood Rd
- 403 Edgewood Rd
- 305 Edgewood Rd
- 405 Edgewood Rd
- 704 Norwood St
- 705 Norwood St
- 407 Edgewood Rd
- 606 Grace St
- 303 Edgewood Rd
- 408 Edgewood Rd
- 702 Norwood St
- 703 Norwood St
- 317 Clinton St
- 608 Grace St
- 410 Edgewood Rd
- 308 Clinton St
- 409 Edgewood Rd
- 804 Westover Terrace
- 302 Edgewood Rd
- 301 Edgewood Rd