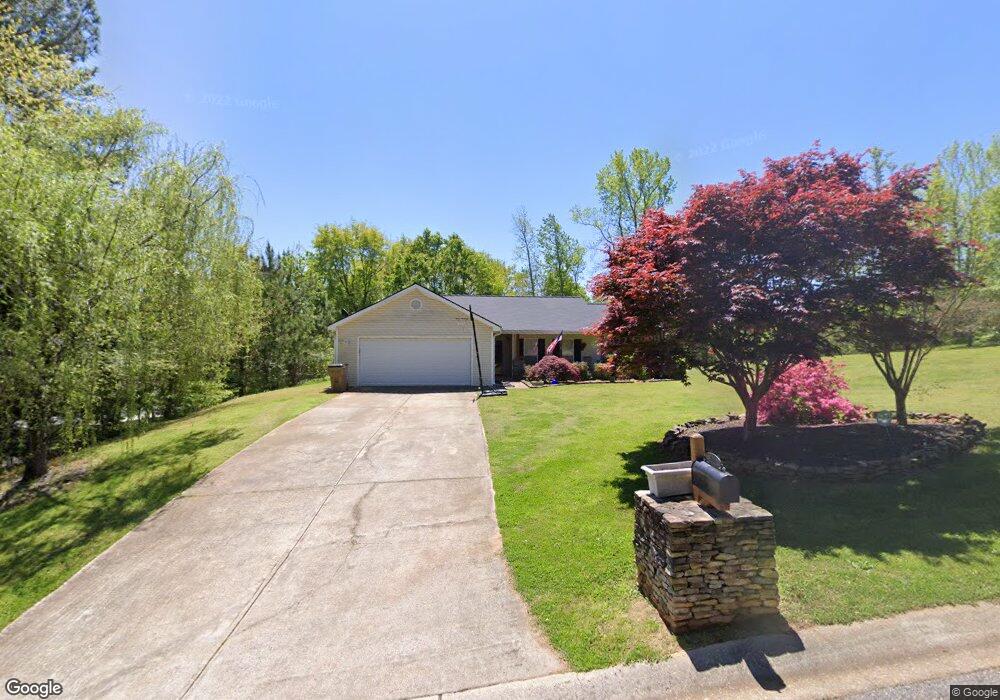
401 Evas Ct Unit 2 Bethlehem, GA 30620
Estimated Value: $278,606 - $300,000
Studio
2
Baths
1,270
Sq Ft
$229/Sq Ft
Est. Value
About This Home
This home is located at 401 Evas Ct Unit 2, Bethlehem, GA 30620 and is currently estimated at $290,652, approximately $228 per square foot. 401 Evas Ct Unit 2 is a home located in Barrow County with nearby schools including Bethlehem Elementary School, Haymon-Morris Middle School, and Apalachee High School.
Ownership History
Date
Name
Owned For
Owner Type
Purchase Details
Closed on
Jul 18, 2007
Sold by
Greeson Sandra M
Bought by
Greeson Shannon and Greeson Sandra M
Current Estimated Value
Home Financials for this Owner
Home Financials are based on the most recent Mortgage that was taken out on this home.
Original Mortgage
$103,200
Outstanding Balance
$64,095
Interest Rate
6.65%
Mortgage Type
New Conventional
Estimated Equity
$226,557
Purchase Details
Closed on
Jun 14, 2002
Sold by
Southfork Homes
Bought by
Phillips Sandra M
Home Financials for this Owner
Home Financials are based on the most recent Mortgage that was taken out on this home.
Original Mortgage
$108,808
Interest Rate
6.75%
Mortgage Type
FHA
Purchase Details
Closed on
Feb 22, 2002
Sold by
Developme Dun La Hur
Bought by
Southfork Homes Inc
Purchase Details
Closed on
May 2, 2000
Bought by
Developme Dun La Hur
Create a Home Valuation Report for This Property
The Home Valuation Report is an in-depth analysis detailing your home's value as well as a comparison with similar homes in the area
Home Values in the Area
Average Home Value in this Area
Purchase History
| Date | Buyer | Sale Price | Title Company |
|---|---|---|---|
| Greeson Shannon | -- | -- | |
| Phillips Sandra M | $109,700 | -- | |
| Southfork Homes Inc | $380,000 | -- | |
| Developme Dun La Hur | -- | -- |
Source: Public Records
Mortgage History
| Date | Status | Borrower | Loan Amount |
|---|---|---|---|
| Open | Greeson Shannon | $103,200 | |
| Previous Owner | Phillips Sandra M | $108,808 |
Source: Public Records
Tax History
| Year | Tax Paid | Tax Assessment Tax Assessment Total Assessment is a certain percentage of the fair market value that is determined by local assessors to be the total taxable value of land and additions on the property. | Land | Improvement |
|---|---|---|---|---|
| 2025 | $2,231 | $95,814 | $23,200 | $72,614 |
| 2024 | $2,318 | $93,764 | $23,200 | $70,564 |
| 2023 | $1,902 | $93,764 | $23,200 | $70,564 |
| 2022 | $1,976 | $69,418 | $16,000 | $53,418 |
| 2021 | $1,811 | $60,380 | $16,000 | $44,380 |
| 2020 | $1,625 | $54,166 | $14,000 | $40,166 |
| 2019 | $1,652 | $54,204 | $14,000 | $40,204 |
| 2018 | $1,629 | $54,204 | $14,000 | $40,204 |
| 2017 | $1,167 | $40,098 | $10,000 | $30,098 |
| 2016 | $1,085 | $37,398 | $10,000 | $27,398 |
| 2015 | $1,098 | $37,705 | $10,000 | $27,705 |
| 2014 | $998 | $34,284 | $6,272 | $28,012 |
| 2013 | -- | $32,922 | $6,272 | $26,650 |
Source: Public Records
Map
Nearby Homes
- 480 Raider Way
- 3243 Lowell Rd
- 511 Grand Oaks Ave
- 3233 Lowell Rd
- 3153 Lowell Rd
- 3283 Lowell Rd
- 154 Blissful Ln
- 0 Tanners Bridge Cir Unit 10536031
- 476 Tanners Bridge Cir Unit 1
- 457 Tanners Bridge Cir Unit 4
- 461 Tanners Bridge Cir Unit 3
- 404 Tanners Bridge Rd
- 1101 Ravenwood Dr
- 1071 Covenant Ct
- 454 Grant Ct
- 1217 Cabin Bridge Rd
- 463 Tanners Bridge Rd Unit 2
- 400 Tanners Bridge Rd
- 396 Tanners Bridge Rd
- 763 Moss Side Dr
- 403 Evas Ct
- 1620 Sedgefield Trail Unit 21
- 1620 Sedgefield Trail Unit 2
- 1620 Sedgefield Trail
- 402 Evas Ct Unit 2
- 402 Evas Ct
- 1615 Sedgefield Trail Unit 2
- 1605 Sedgefield Trail
- 1625 Sedgefield Trail
- 1630 Sedgefield Trail
- 1630 Sedgefield Trail Unit 2
- 405 Evas Ct Unit 2
- 405 Evas Ct
- 404 Evas Ct
- 1595 Sedgefield Trail Unit 2
- 1635 Sedgefield Trail Unit 2
- 1580 Sedgefield Trail
- 1580 Sedgefield Trail Unit 27
- 1640 Sedgefield Trail
- 1585 Sedgefield Trail
Your Personal Tour Guide
Ask me questions while you tour the home.