Estimated Value: $38,106 - $138,000
--
Bed
1
Bath
1,166
Sq Ft
$77/Sq Ft
Est. Value
About This Home
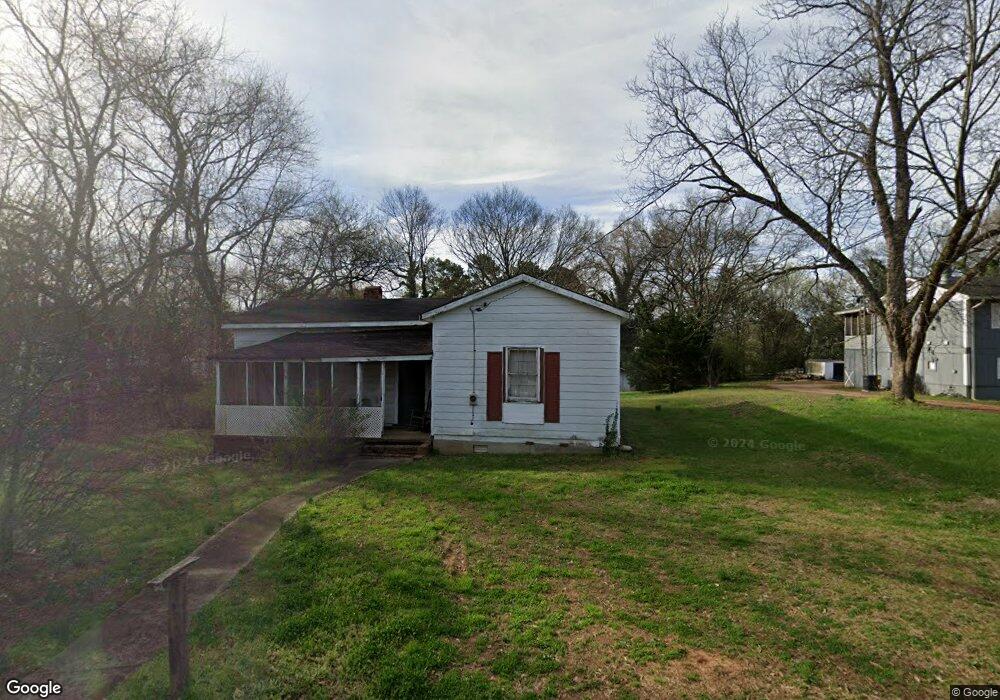
This home is located at 401 Evergreen St SW, Rome, GA 30161 and is currently estimated at $89,777, approximately $76 per square foot. 401 Evergreen St SW is a home located in Floyd County with nearby schools including Dan McCarty Middle School, Rome High School, and Darlington School.
Ownership History
Date
Name
Owned For
Owner Type
Purchase Details
Closed on
Nov 10, 2014
Sold by
Roman Amy
Bought by
Hernandez Carlos A
Current Estimated Value
Purchase Details
Closed on
Jan 9, 2013
Sold by
Thompson Joann L
Bought by
Roman Amy
Purchase Details
Closed on
Oct 15, 2002
Sold by
O'Neill Jonathan J
Bought by
Thompson Joann L
Purchase Details
Closed on
Jan 7, 2002
Sold by
Morgan Vera Oneill
Bought by
O'Neill Jonathan J
Purchase Details
Closed on
Dec 10, 1984
Sold by
Morgan Vera Oneil Etal
Bought by
Morgan Vera Oneill
Purchase Details
Closed on
Nov 19, 1984
Bought by
P and R
Purchase Details
Closed on
Nov 2, 1984
Bought by
P and R
Purchase Details
Closed on
Nov 1, 1984
Bought by
P and R
Purchase Details
Closed on
Jan 1, 1981
Sold by
Dozie Lizzie
Bought by
Morgan Vera Oneil Etal
Purchase Details
Closed on
Dec 31, 1969
Sold by
Dozier Abraham
Bought by
Dozie Lizzie
Purchase Details
Closed on
Jan 1, 1901
Bought by
Dozier Abraham
Create a Home Valuation Report for This Property
The Home Valuation Report is an in-depth analysis detailing your home's value as well as a comparison with similar homes in the area
Home Values in the Area
Average Home Value in this Area
Purchase History
| Date | Buyer | Sale Price | Title Company |
|---|---|---|---|
| Hernandez Carlos A | $4,500 | -- | |
| Roman Amy | $3,000 | -- | |
| Thompson Joann L | $12,000 | -- | |
| O'Neill Jonathan J | -- | -- | |
| Morgan Vera Oneill | -- | -- | |
| P | -- | -- | |
| P | -- | -- | |
| P | -- | -- | |
| Morgan Vera Oneil Etal | -- | -- | |
| Dozie Lizzie | -- | -- | |
| Dozier Abraham | -- | -- |
Source: Public Records
Tax History Compared to Growth
Tax History
| Year | Tax Paid | Tax Assessment Tax Assessment Total Assessment is a certain percentage of the fair market value that is determined by local assessors to be the total taxable value of land and additions on the property. | Land | Improvement |
|---|---|---|---|---|
| 2024 | $290 | $7,470 | $6,470 | $1,000 |
| 2023 | $265 | $6,546 | $5,546 | $1,000 |
| 2022 | $205 | $5,622 | $4,622 | $1,000 |
| 2021 | $209 | $5,622 | $4,622 | $1,000 |
| 2020 | $176 | $4,697 | $3,697 | $1,000 |
| 2019 | $174 | $4,697 | $3,697 | $1,000 |
| 2018 | $174 | $4,697 | $3,697 | $1,000 |
| 2017 | $174 | $4,697 | $3,697 | $1,000 |
| 2016 | $174 | $4,680 | $3,680 | $1,000 |
| 2015 | -- | $4,680 | $3,680 | $1,000 |
| 2014 | -- | $11,097 | $3,680 | $7,417 |
Source: Public Records
Map
Nearby Homes
- 1901 Hull Ave SW
- 0 Martha Berry Hwy Unit 7525627
- 0 Martha Berry Hwy Unit 7614774
- 0 Martha Berry Hwy Unit 10563404
- 2014 Maple Ave SW
- 304 E 19th St SW
- 2108 Maple Ave SW
- 7 Willingham St SW
- 14 Clover St SW
- 000 E Oglethorpe Hwy
- 39 E 16th St SW
- 106 E 14th St SW
- 1705 Olmstead St SW
- 107 E Linden St SE
- 111 Hosea St SW
- 414 E 17th St SW
- 2508 Maple Rd SE
- 2501 Maple Rd SE
- 316 S McLin St SW
- 4 E 15th St SW
- 403 Evergreen St SW
- 700 Cedar Ave SW
- 402 Evergreen St SW
- 402 Evergreen St SW
- 612 Cedar Ave SW
- 710 Cedar Ave SW
- 705 Cedar Ave SW
- 705 Cedar Ave SW
- 705 Cedar Ave SW
- 608 Cedar Ave SW
- 615 Cedar Ave SW
- 709 Cedar Ave SW
- 205 Evergreen St SW
- 613 Cedar Ave SW
- 408 E 20th St SW
- 604 Cedar Ave SW
- 611 Cedar Ave SW
- 609 Cedar Ave SW
- 2014 Hull Ave SW
- 2010 Hull Ave SW