Estimated Value: $47,316 - $69,000
2
Beds
1
Bath
894
Sq Ft
$63/Sq Ft
Est. Value
About This Home
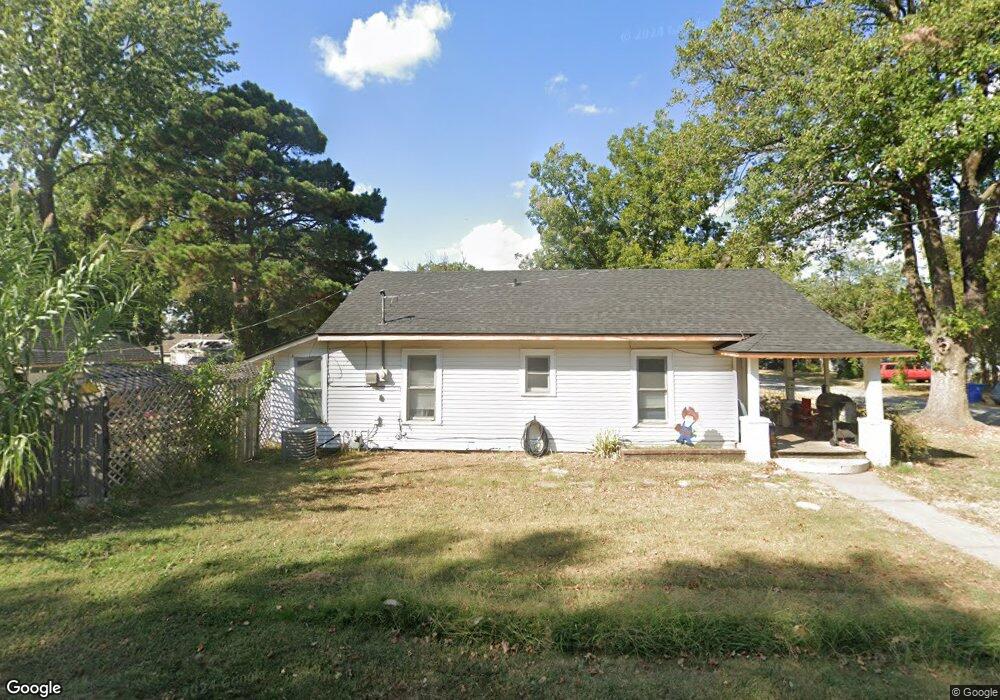
This home is located at 401 F St NE, Miami, OK 74354 and is currently estimated at $56,329, approximately $63 per square foot. 401 F St NE is a home located in Ottawa County with nearby schools including Miami High School and Mt. Olive Lutheran School.
Ownership History
Date
Name
Owned For
Owner Type
Purchase Details
Closed on
Nov 10, 2020
Sold by
Stratton Danny Lee and Estate Of Betty L Stratton
Bought by
Thomas Kenneth A and Thomas Tara
Current Estimated Value
Home Financials for this Owner
Home Financials are based on the most recent Mortgage that was taken out on this home.
Original Mortgage
$17,000
Outstanding Balance
$5,501
Interest Rate
3.5%
Mortgage Type
New Conventional
Estimated Equity
$50,828
Purchase Details
Closed on
Mar 3, 1999
Bought by
Stratton Dudley D and Stratton Betty L
Purchase Details
Closed on
Aug 4, 1997
Bought by
Pruitt Jamee Dawn
Purchase Details
Closed on
Jul 3, 1978
Bought by
Goforth Brenda Sue
Create a Home Valuation Report for This Property
The Home Valuation Report is an in-depth analysis detailing your home's value as well as a comparison with similar homes in the area
Home Values in the Area
Average Home Value in this Area
Purchase History
| Date | Buyer | Sale Price | Title Company |
|---|---|---|---|
| Thomas Kenneth A | $20,000 | None Available | |
| Stratton Dudley D | $15,000 | -- | |
| Pruitt Jamee Dawn | -- | -- | |
| Goforth Brenda Sue | -- | -- |
Source: Public Records
Mortgage History
| Date | Status | Borrower | Loan Amount |
|---|---|---|---|
| Open | Thomas Kenneth A | $17,000 |
Source: Public Records
Tax History Compared to Growth
Tax History
| Year | Tax Paid | Tax Assessment Tax Assessment Total Assessment is a certain percentage of the fair market value that is determined by local assessors to be the total taxable value of land and additions on the property. | Land | Improvement |
|---|---|---|---|---|
| 2025 | $276 | $3,534 | $285 | $3,249 |
| 2024 | $276 | $3,858 | $285 | $3,573 |
| 2023 | $276 | $3,889 | $285 | $3,604 |
| 2022 | $267 | $3,889 | $285 | $3,604 |
| 2021 | $273 | $3,889 | $285 | $3,604 |
| 2020 | $249 | $2,621 | $270 | $2,351 |
| 2019 | $205 | $2,496 | $268 | $2,228 |
| 2018 | $196 | $2,377 | $267 | $2,110 |
| 2017 | $190 | $2,265 | $267 | $1,998 |
| 2016 | $173 | $2,157 | $266 | $1,891 |
| 2015 | $158 | $1,774 | $321 | $1,453 |
| 2014 | $168 | $2,054 | $236 | $1,818 |
Source: Public Records
Map
Nearby Homes