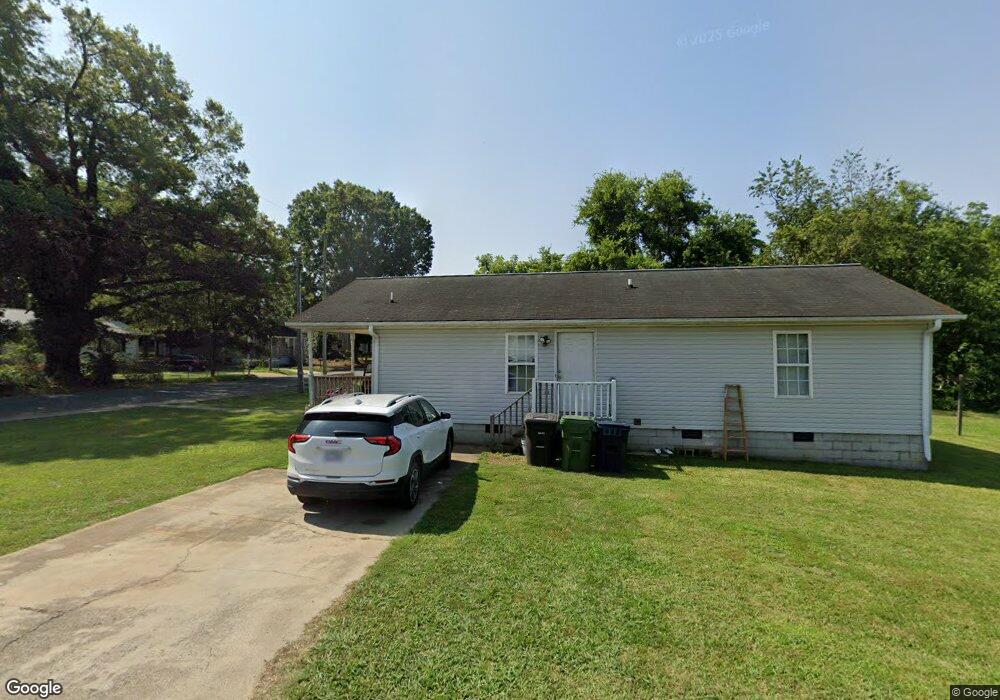
401 Foy Ave Lexington, NC 27292
Estimated Value: $94,000 - $160,000
3
Beds
1
Bath
1,100
Sq Ft
$125/Sq Ft
Est. Value
About This Home
This home is located at 401 Foy Ave, Lexington, NC 27292 and is currently estimated at $137,958, approximately $125 per square foot. 401 Foy Ave is a home located in Davidson County with nearby schools including South Lexington School, Lexington Middle School, and Lexington Senior High School.
Ownership History
Date
Name
Owned For
Owner Type
Purchase Details
Closed on
Aug 3, 2023
Sold by
Rb Capital Group Llc
Bought by
Delcarmen Castellanos Hernand Maria
Current Estimated Value
Purchase Details
Closed on
Oct 17, 2018
Sold by
Hedrick Bradley D and Hedrick Jane E
Bought by
Rb Capital Group Llc
Purchase Details
Closed on
Sep 20, 2010
Sold by
Nicholson Danny R and Nicholson Patricia L
Bought by
Hedrick Bradley D
Purchase Details
Closed on
Jul 1, 1998
Purchase Details
Closed on
Mar 1, 1996
Purchase Details
Closed on
May 1, 1983
Create a Home Valuation Report for This Property
The Home Valuation Report is an in-depth analysis detailing your home's value as well as a comparison with similar homes in the area
Home Values in the Area
Average Home Value in this Area
Purchase History
| Date | Buyer | Sale Price | Title Company |
|---|---|---|---|
| Delcarmen Castellanos Hernand Maria | $55,000 | Chicago Title | |
| Rb Capital Group Llc | -- | None Available | |
| Hedrick Bradley D | -- | Chicago Title Insurance Co | |
| -- | $226,500 | -- | |
| -- | -- | -- | |
| -- | $13,000 | -- |
Source: Public Records
Tax History Compared to Growth
Tax History
| Year | Tax Paid | Tax Assessment Tax Assessment Total Assessment is a certain percentage of the fair market value that is determined by local assessors to be the total taxable value of land and additions on the property. | Land | Improvement |
|---|---|---|---|---|
| 2025 | $1,013 | $77,890 | $0 | $0 |
| 2024 | $1,013 | $77,890 | $0 | $0 |
| 2023 | $1,013 | $77,890 | $0 | $0 |
| 2022 | $1,013 | $77,890 | $0 | $0 |
| 2021 | $1,013 | $77,890 | $0 | $0 |
| 2020 | $921 | $71,400 | $0 | $0 |
| 2019 | $935 | $71,400 | $0 | $0 |
| 2018 | $935 | $71,400 | $0 | $0 |
| 2017 | $935 | $71,400 | $0 | $0 |
| 2016 | $935 | $71,400 | $0 | $0 |
| 2015 | $900 | $71,400 | $0 | $0 |
| 2014 | $651 | $51,630 | $0 | $0 |
Source: Public Records
Map
Nearby Homes