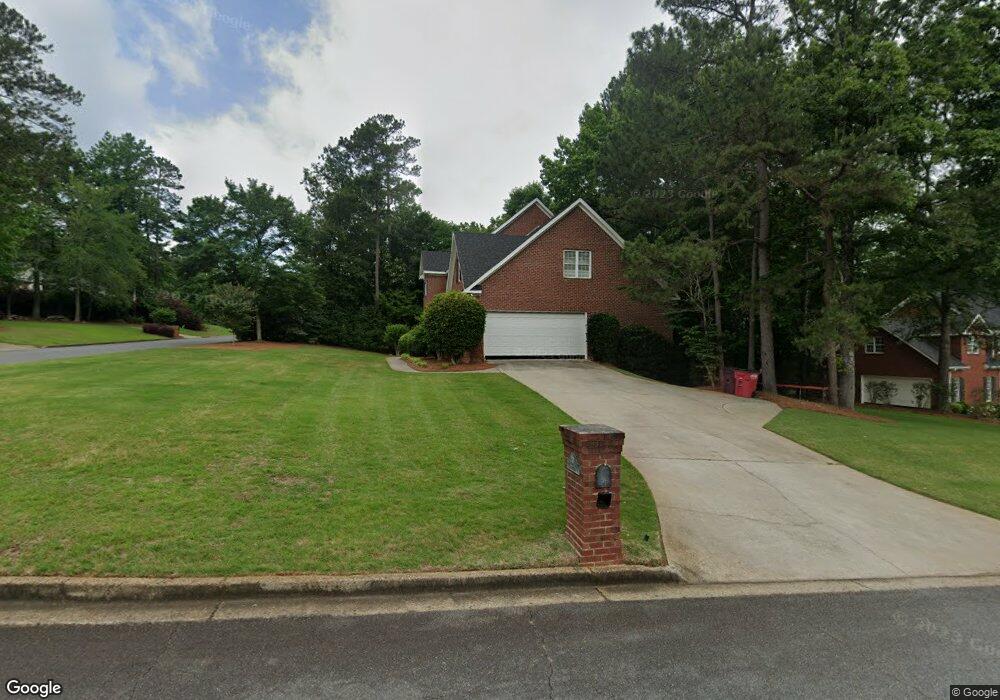
401 Gentry Walk Unit 13 Macon, GA 31210
Estimated Value: $441,000 - $495,000
6
Beds
4
Baths
3,367
Sq Ft
$142/Sq Ft
Est. Value
About This Home
This home is located at 401 Gentry Walk Unit 13, Macon, GA 31210 and is currently estimated at $477,850, approximately $141 per square foot. 401 Gentry Walk Unit 13 is a home located in Bibb County with nearby schools including Springdale Elementary School, Howard Middle School, and Howard High School.
Ownership History
Date
Name
Owned For
Owner Type
Purchase Details
Closed on
Jan 19, 2024
Sold by
Fedelini Gianluca C and Fedelini Jessica W
Bought by
Yacucci Theodore
Current Estimated Value
Home Financials for this Owner
Home Financials are based on the most recent Mortgage that was taken out on this home.
Original Mortgage
$293,000
Outstanding Balance
$287,600
Interest Rate
6.95%
Mortgage Type
New Conventional
Estimated Equity
$190,250
Purchase Details
Closed on
Jun 11, 2010
Sold by
Graham Jeff and Graham Nancy
Bought by
Fedelini Gianluca C and Fedelini Jessica W
Home Financials for this Owner
Home Financials are based on the most recent Mortgage that was taken out on this home.
Original Mortgage
$330,125
Interest Rate
3.87%
Mortgage Type
New Conventional
Purchase Details
Closed on
Apr 19, 2004
Bought by
Graham Jeff and Graham Nancy
Purchase Details
Closed on
Jun 15, 2000
Purchase Details
Closed on
Sep 30, 1998
Purchase Details
Closed on
Mar 11, 1998
Create a Home Valuation Report for This Property
The Home Valuation Report is an in-depth analysis detailing your home's value as well as a comparison with similar homes in the area
Home Values in the Area
Average Home Value in this Area
Purchase History
| Date | Buyer | Sale Price | Title Company |
|---|---|---|---|
| Yacucci Theodore | $393,000 | None Listed On Document | |
| Fedelini Gianluca C | $347,500 | None Available | |
| Graham Jeff | $330,000 | -- | |
| -- | $290,000 | -- | |
| -- | $300,000 | -- | |
| -- | $46,000 | -- |
Source: Public Records
Mortgage History
| Date | Status | Borrower | Loan Amount |
|---|---|---|---|
| Open | Yacucci Theodore | $293,000 | |
| Previous Owner | Fedelini Gianluca C | $330,125 |
Source: Public Records
Tax History Compared to Growth
Tax History
| Year | Tax Paid | Tax Assessment Tax Assessment Total Assessment is a certain percentage of the fair market value that is determined by local assessors to be the total taxable value of land and additions on the property. | Land | Improvement |
|---|---|---|---|---|
| 2025 | $3,657 | $155,818 | $27,000 | $128,818 |
| 2024 | $4,846 | $197,822 | $30,000 | $167,822 |
| 2023 | $3,531 | $164,018 | $24,000 | $140,018 |
| 2022 | $4,885 | $148,104 | $23,940 | $124,164 |
| 2021 | $5,362 | $148,104 | $23,940 | $124,164 |
| 2020 | $4,699 | $128,027 | $21,420 | $106,607 |
| 2019 | $4,738 | $128,027 | $21,420 | $106,607 |
| 2018 | $7,435 | $128,027 | $21,420 | $106,607 |
| 2017 | $4,017 | $114,218 | $21,420 | $92,798 |
| 2016 | $3,618 | $111,576 | $21,420 | $90,156 |
| 2015 | $5,086 | $110,844 | $21,420 | $89,424 |
| 2014 | $5,712 | $123,440 | $22,680 | $100,760 |
Source: Public Records
Map
Nearby Homes
- 578 Edgefield Way
- 100 S Haven Ct
- 4265 Sheraton Dr
- 101 Westchester Dr
- 630 Millrun Ct
- 1375 Bass Rd
- 123 Saddle Run Ct
- 1231 Woodcrest Dr
- 115 Saddle Run Ct
- 169 Brookefield Dr
- 504 Edgefield Way
- 171 Lake View Dr N
- 309 Millwood Ct
- 205 Ashbrooke Ct
- 1177 Lucky Debonair Dr
- 1021 Bass Rd
- 414 Waverly Ln
- 609 Waverly Ct
- 5761 Kentucky Downs Dr
- 2080 Bowman Park
- 401 Gentry Walk
- 148 Westchester Dr
- 148 Westchester Dr Unit 264
- 405 Gentry Walk
- 159 Westchester Dr
- 155 Westchester Dr
- 151 Westchester Dr
- 400 Gentry Walk
- 409 Gentry Walk
- 144 Westchester Dr
- 147 Westchester Dr
- 404 Gentry Walk
- 408 Gentry Walk
- 143 Westchester Dr
- 140 Westchester Dr
- 132 Westchester Dr
- 1715 Rivoli Ln
- 1695 Rivoli Ln
- 163 Westchester Dr
- 128 Westchester Dr