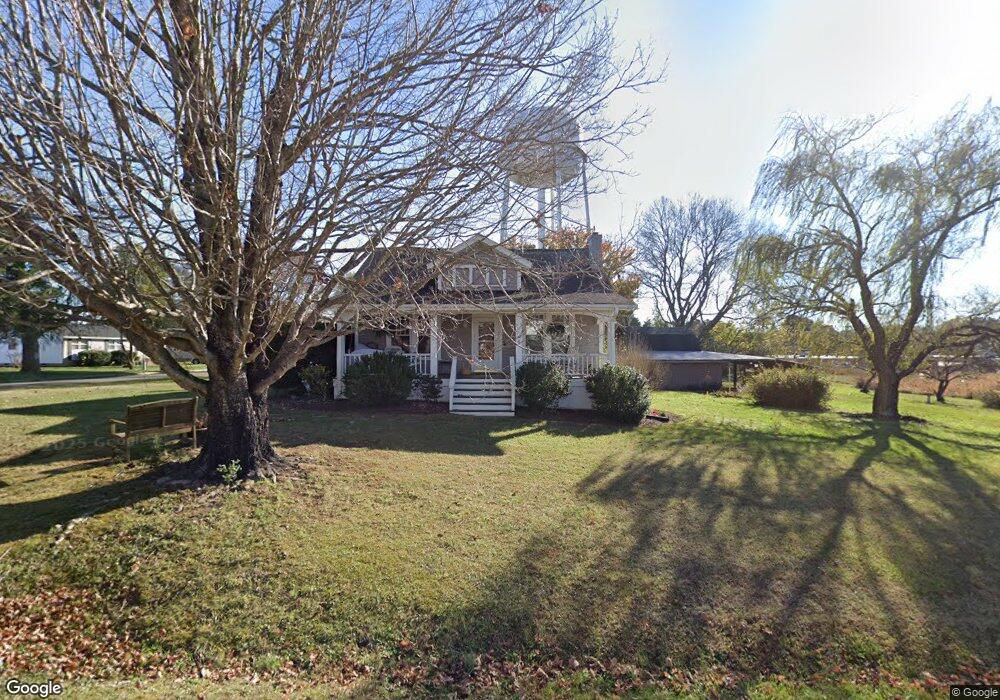
401 Grove St Oxford, NC 27565
Estimated Value: $259,277 - $293,000
3
Beds
2
Baths
1,780
Sq Ft
$153/Sq Ft
Est. Value
About This Home
This home is located at 401 Grove St, Oxford, NC 27565 and is currently estimated at $272,819, approximately $153 per square foot. 401 Grove St is a home located in Granville County with nearby schools including West Oxford Elementary School, Northern Granville Middle School, and J.F. Webb High School.
Ownership History
Date
Name
Owned For
Owner Type
Purchase Details
Closed on
Sep 25, 2009
Sold by
Haywood Tony F and Haywood Lisa M
Bought by
Smith Leslie H
Current Estimated Value
Home Financials for this Owner
Home Financials are based on the most recent Mortgage that was taken out on this home.
Original Mortgage
$117,826
Outstanding Balance
$77,017
Interest Rate
5.1%
Mortgage Type
FHA
Estimated Equity
$195,802
Purchase Details
Closed on
Feb 28, 2006
Sold by
Bank Of America Na
Bought by
Jordan Linda
Home Financials for this Owner
Home Financials are based on the most recent Mortgage that was taken out on this home.
Original Mortgage
$12,600
Interest Rate
6.19%
Mortgage Type
Credit Line Revolving
Create a Home Valuation Report for This Property
The Home Valuation Report is an in-depth analysis detailing your home's value as well as a comparison with similar homes in the area
Home Values in the Area
Average Home Value in this Area
Purchase History
| Date | Buyer | Sale Price | Title Company |
|---|---|---|---|
| Smith Leslie H | $120,000 | -- | |
| Jordan Linda | $63,000 | -- |
Source: Public Records
Mortgage History
| Date | Status | Borrower | Loan Amount |
|---|---|---|---|
| Open | Smith Leslie H | $117,826 | |
| Previous Owner | Jordan Linda | $12,600 | |
| Previous Owner | Jordan Linda | $44,100 |
Source: Public Records
Tax History Compared to Growth
Tax History
| Year | Tax Paid | Tax Assessment Tax Assessment Total Assessment is a certain percentage of the fair market value that is determined by local assessors to be the total taxable value of land and additions on the property. | Land | Improvement |
|---|---|---|---|---|
| 2025 | $1,602 | $226,757 | $51,750 | $175,007 |
| 2024 | $1,602 | $226,757 | $51,750 | $175,007 |
| 2023 | $1,089 | $118,168 | $25,875 | $92,293 |
| 2022 | $1,095 | $118,168 | $25,875 | $92,293 |
| 2021 | $1,019 | $118,168 | $25,875 | $92,293 |
| 2020 | $1,019 | $118,168 | $25,875 | $92,293 |
| 2019 | $1,019 | $118,168 | $25,875 | $92,293 |
| 2018 | $1,019 | $118,168 | $25,875 | $92,293 |
| 2016 | $988 | $109,298 | $25,875 | $83,423 |
| 2015 | $928 | $109,298 | $25,875 | $83,423 |
| 2014 | $928 | $109,298 | $25,875 | $83,423 |
| 2013 | -- | $109,298 | $25,875 | $83,423 |
Source: Public Records
Map
Nearby Homes
- 127 Daniel St
- 200 W Westbury Dr
- 103 Alston Ct
- 735 Baker St
- 616 Roxboro Rd
- 722 Baker St
- 611 College St
- 316 Keeneland Dr
- 511 Broad St
- 410 College St
- 114 Hays St
- 609 N Country Club Dr
- 304 Lanier St
- 204 Cardinal Ct
- 206 Cardinal Ct
- 112 Rectory St
- 214 College St
- 300 Coleman St
- 6609 Clearwater Dr
- 96 North St