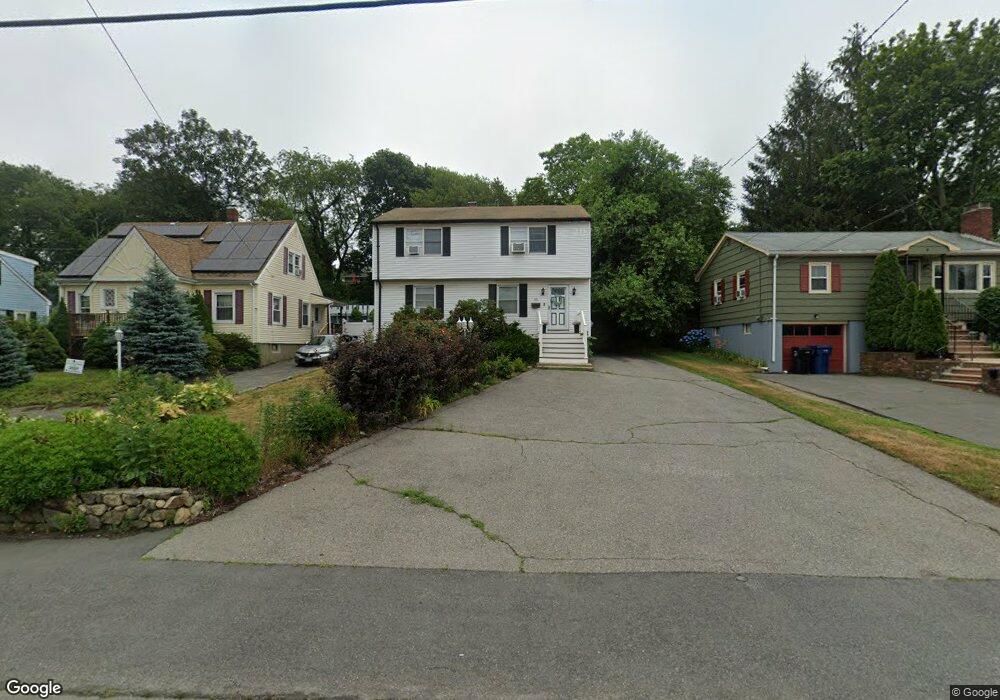
401 Highland Ave Salem, MA 01970
Highland Avenue NeighborhoodEstimated Value: $695,740 - $781,000
5
Beds
2
Baths
1,888
Sq Ft
$392/Sq Ft
Est. Value
About This Home
This home is located at 401 Highland Ave, Salem, MA 01970 and is currently estimated at $740,185, approximately $392 per square foot. 401 Highland Ave is a home located in Essex County with nearby schools including Horace Mann Laboratory, Witchcraft Heights Elementary School, and Saltonstall School.
Ownership History
Date
Name
Owned For
Owner Type
Purchase Details
Closed on
Feb 17, 2006
Sold by
Nelson Joyce E and Correale Michael C
Bought by
Cruz Marina and Cruz Samuel
Current Estimated Value
Home Financials for this Owner
Home Financials are based on the most recent Mortgage that was taken out on this home.
Original Mortgage
$303,200
Outstanding Balance
$170,993
Interest Rate
6.23%
Mortgage Type
Purchase Money Mortgage
Estimated Equity
$569,192
Create a Home Valuation Report for This Property
The Home Valuation Report is an in-depth analysis detailing your home's value as well as a comparison with similar homes in the area
Home Values in the Area
Average Home Value in this Area
Purchase History
| Date | Buyer | Sale Price | Title Company |
|---|---|---|---|
| Cruz Marina | $379,000 | -- |
Source: Public Records
Mortgage History
| Date | Status | Borrower | Loan Amount |
|---|---|---|---|
| Open | Cruz Marina | $303,200 |
Source: Public Records
Tax History Compared to Growth
Tax History
| Year | Tax Paid | Tax Assessment Tax Assessment Total Assessment is a certain percentage of the fair market value that is determined by local assessors to be the total taxable value of land and additions on the property. | Land | Improvement |
|---|---|---|---|---|
| 2025 | $6,274 | $553,300 | $172,100 | $381,200 |
| 2024 | $6,107 | $525,600 | $172,100 | $353,500 |
| 2023 | $5,827 | $465,800 | $151,900 | $313,900 |
| 2022 | $5,935 | $447,900 | $141,800 | $306,100 |
| 2021 | $5,635 | $408,300 | $132,300 | $276,000 |
| 2020 | $5,701 | $394,500 | $137,000 | $257,500 |
| 2019 | $5,567 | $368,700 | $124,900 | $243,800 |
| 2018 | $4,883 | $317,500 | $108,000 | $209,500 |
| 2017 | $4,476 | $282,200 | $86,400 | $195,800 |
| 2016 | $4,422 | $282,200 | $86,400 | $195,800 |
| 2015 | $4,194 | $255,600 | $74,200 | $181,400 |
Source: Public Records
Map
Nearby Homes
- 19 Clark St
- 12 Tanglewood Ln Unit 12
- 6 Countryside Ln Unit 1303
- 17 Lions Ln
- 2 Sophia Rd
- 16 Appleby Rd
- 18 Appleby Rd
- 11 Woodlands Rd
- 8 Wyman Ave
- 54 Cavendish Cir
- 16 Whalers Ln Unit 16
- 32 Whalers Ln Unit C
- 16 Admirals Ln Unit 16
- 22 Celestial Way
- 13 Bengal Ln
- 62 Fays Ave
- 43 Bickford St
- 25 Monte Rd
- 15 Monte Rd
- 26 Manson St