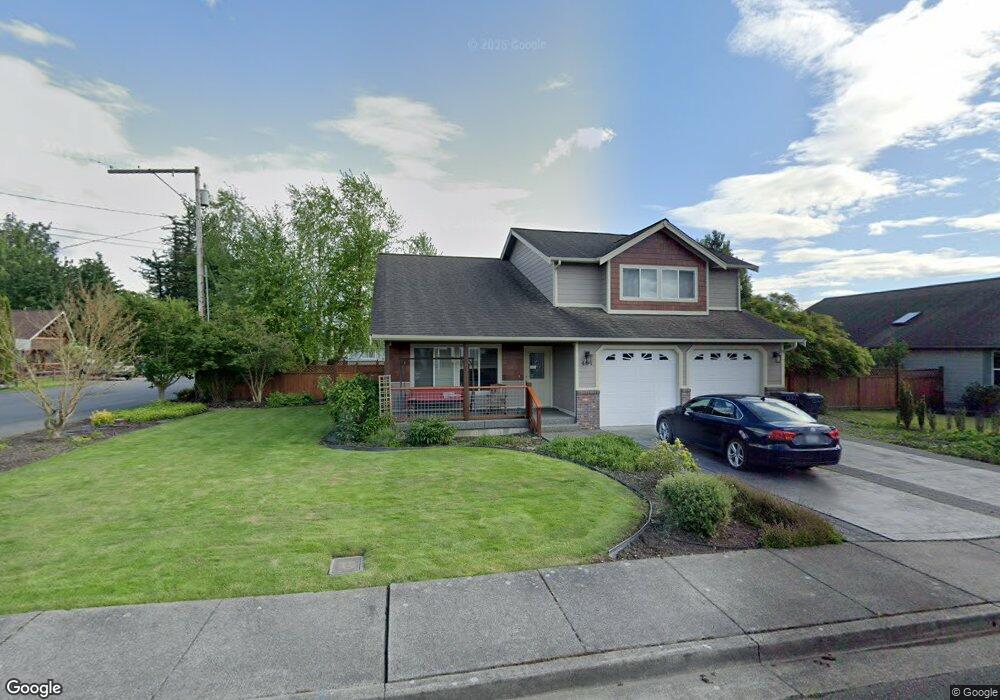
401 Jackson Ct Nooksack, WA 98247
Estimated Value: $555,702 - $593,000
4
Beds
3
Baths
2,210
Sq Ft
$258/Sq Ft
Est. Value
About This Home
This home is located at 401 Jackson Ct, Nooksack, WA 98247 and is currently estimated at $571,176, approximately $258 per square foot. 401 Jackson Ct is a home located in Whatcom County with nearby schools including Nooksack Elementary School, Everson Elementary School, and Sumas Elementary School.
Ownership History
Date
Name
Owned For
Owner Type
Purchase Details
Closed on
Aug 29, 2007
Sold by
Gateway Management Services Inc
Bought by
Moore Rick D and Moore Linda S
Current Estimated Value
Home Financials for this Owner
Home Financials are based on the most recent Mortgage that was taken out on this home.
Original Mortgage
$224,000
Outstanding Balance
$140,439
Interest Rate
6.74%
Mortgage Type
Purchase Money Mortgage
Estimated Equity
$430,737
Purchase Details
Closed on
May 23, 2005
Sold by
Dennison Roy E and Dennison Lou Anne
Bought by
Gateway Management Services Inc
Home Financials for this Owner
Home Financials are based on the most recent Mortgage that was taken out on this home.
Original Mortgage
$200,000
Interest Rate
5.84%
Mortgage Type
Seller Take Back
Create a Home Valuation Report for This Property
The Home Valuation Report is an in-depth analysis detailing your home's value as well as a comparison with similar homes in the area
Purchase History
| Date | Buyer | Sale Price | Title Company |
|---|---|---|---|
| Moore Rick D | $280,280 | Whatcom Land Title | |
| Gateway Management Services Inc | -- | Whatcom Land Title | |
| Gateway Management Services Inc | $400,000 | Whatcom Land Title |
Source: Public Records
Mortgage History
| Date | Status | Borrower | Loan Amount |
|---|---|---|---|
| Open | Moore Rick D | $224,000 | |
| Previous Owner | Gateway Management Services Inc | $200,000 |
Source: Public Records
Tax History
| Year | Tax Paid | Tax Assessment Tax Assessment Total Assessment is a certain percentage of the fair market value that is determined by local assessors to be the total taxable value of land and additions on the property. | Land | Improvement |
|---|---|---|---|---|
| 2025 | $4,567 | $515,319 | $188,100 | $327,219 |
| 2024 | $4,699 | $499,238 | $180,000 | $319,238 |
| 2023 | $4,699 | $533,086 | $137,744 | $395,342 |
| 2022 | $4,302 | $480,267 | $124,096 | $356,171 |
| 2021 | $3,990 | $396,920 | $102,560 | $294,360 |
| 2020 | $3,826 | $322,707 | $83,384 | $239,323 |
| 2019 | $3,223 | $322,707 | $83,384 | $239,323 |
| 2018 | $3,828 | $309,610 | $80,000 | $229,610 |
| 2017 | $3,421 | $273,570 | $63,800 | $209,770 |
| 2016 | $3,266 | $252,457 | $58,850 | $193,607 |
| 2015 | $2,771 | $242,105 | $56,760 | $185,345 |
| 2014 | -- | $234,598 | $55,000 | $179,598 |
| 2013 | -- | $234,598 | $55,000 | $179,598 |
Source: Public Records
Map
Nearby Homes
- 412 W 3rd St
- 404 W 3rd St
- 308 W 3rd St
- 304 W 3rd St
- 109 W 2nd St
- 303 Hayes St
- 107 Thendara Park Dr Unit C
- 512 Allison Way
- 107 S Pass Rd Unit 23
- 705 E 6th St
- 702 N Washington St
- 207 E Main St
- 108 Baker St Unit 1-4
- 7554 Nooksack Rd
- 3292 S Pass Rd
- 409 W 4th St
- 303 Lincoln St
- 0 Walnut Grove Ct
- 408 W 3rd St
- 416 W 3rd St
Your Personal Tour Guide
Ask me questions while you tour the home.