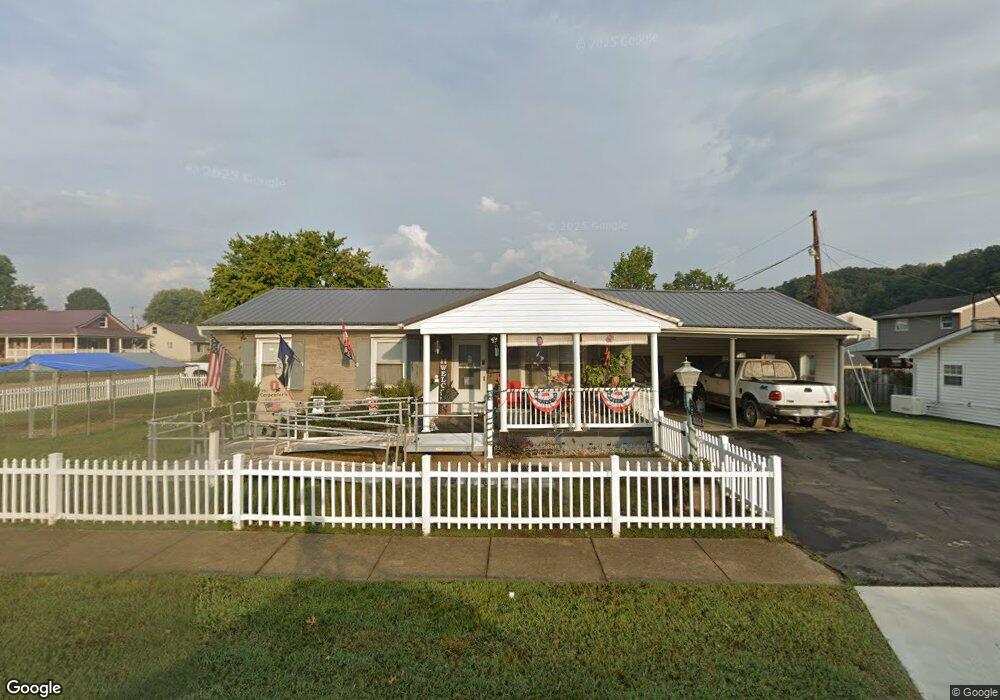
401 Jeannine St Ironton, OH 45638
Estimated Value: $143,135 - $158,000
3
Beds
2
Baths
988
Sq Ft
$151/Sq Ft
Est. Value
About This Home
This home is located at 401 Jeannine St, Ironton, OH 45638 and is currently estimated at $149,034, approximately $150 per square foot. 401 Jeannine St is a home located in Lawrence County with nearby schools including Ironton Elementary School, Ironton Middle School, and Ironton High School.
Ownership History
Date
Name
Owned For
Owner Type
Purchase Details
Closed on
Feb 2, 2018
Sold by
Carpenter Lee Ann
Bought by
Carpenter Lee Ann
Current Estimated Value
Purchase Details
Closed on
Oct 30, 2017
Sold by
Carpenter William J and Carpenter Lee Ann
Bought by
Carpenter Lee Ann and Carpenter William J
Home Financials for this Owner
Home Financials are based on the most recent Mortgage that was taken out on this home.
Original Mortgage
$53,000
Interest Rate
3.85%
Mortgage Type
New Conventional
Purchase Details
Closed on
Apr 25, 2017
Sold by
Vinson Helen M Lifes Est & Philip O
Bought by
Lee Ann Carpenter and Phillip O Vinson
Purchase Details
Closed on
Aug 24, 1993
Sold by
Vinson Philip O and Vinson Helen
Bought by
Vinson Helen M Lifes Es
Purchase Details
Closed on
Jul 8, 1993
Sold by
Vinson Philip O and Vinson Helen
Bought by
Vinson Philip O and Vinson Helen
Create a Home Valuation Report for This Property
The Home Valuation Report is an in-depth analysis detailing your home's value as well as a comparison with similar homes in the area
Home Values in the Area
Average Home Value in this Area
Purchase History
| Date | Buyer | Sale Price | Title Company |
|---|---|---|---|
| Carpenter Lee Ann | -- | -- | |
| Carpenter Lee Ann | $30,000 | None Available | |
| Lee Ann Carpenter | -- | -- | |
| Vinson Helen M Lifes Es | -- | -- | |
| Vinson Philip O | -- | -- |
Source: Public Records
Mortgage History
| Date | Status | Borrower | Loan Amount |
|---|---|---|---|
| Previous Owner | Carpenter Lee Ann | $53,000 |
Source: Public Records
Tax History Compared to Growth
Tax History
| Year | Tax Paid | Tax Assessment Tax Assessment Total Assessment is a certain percentage of the fair market value that is determined by local assessors to be the total taxable value of land and additions on the property. | Land | Improvement |
|---|---|---|---|---|
| 2024 | -- | $33,590 | $7,720 | $25,870 |
| 2023 | $1,242 | $33,590 | $7,720 | $25,870 |
| 2022 | $1,240 | $33,590 | $7,720 | $25,870 |
| 2021 | $1,170 | $30,370 | $6,390 | $23,980 |
| 2020 | $1,186 | $30,370 | $6,390 | $23,980 |
| 2019 | $1,181 | $30,370 | $6,390 | $23,980 |
| 2018 | $1,194 | $30,370 | $6,390 | $23,980 |
| 2017 | $832 | $30,370 | $6,390 | $23,980 |
| 2016 | $780 | $30,370 | $6,390 | $23,980 |
| 2015 | $603 | $24,800 | $6,390 | $18,410 |
| 2014 | $582 | $24,800 | $6,390 | $18,410 |
| 2013 | $580 | $24,800 | $6,390 | $18,410 |
Source: Public Records
Map
Nearby Homes