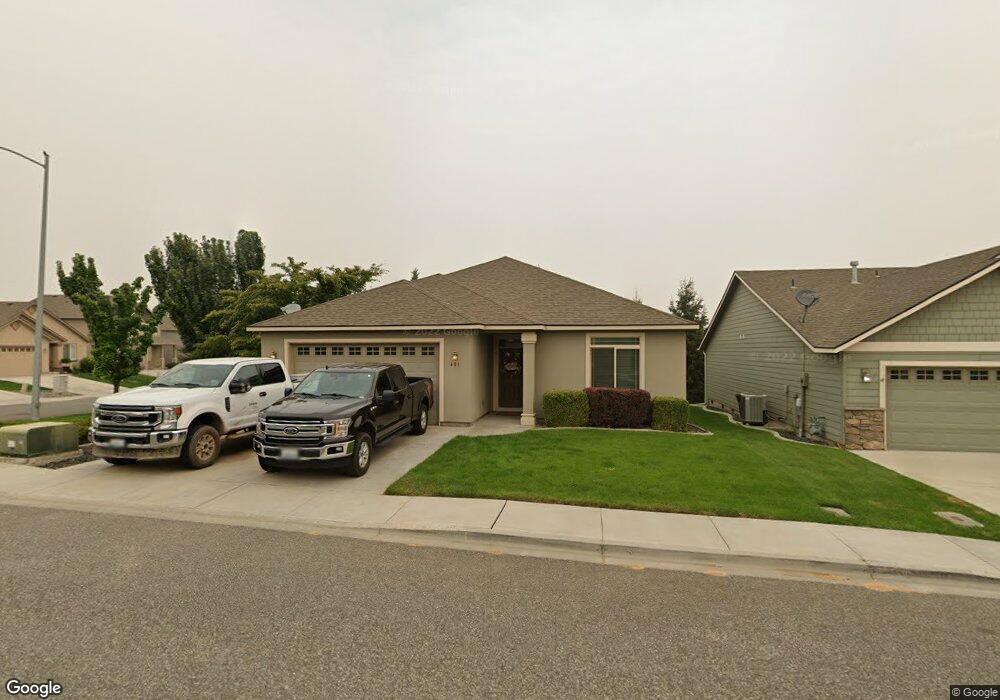
401 Lakerose Loop Richland, WA 99352
Estimated Value: $426,000 - $484,000
3
Beds
3
Baths
1,628
Sq Ft
$279/Sq Ft
Est. Value
About This Home
This home is located at 401 Lakerose Loop, Richland, WA 99352 and is currently estimated at $453,986, approximately $278 per square foot. 401 Lakerose Loop is a home located in Benton County with nearby schools including Orchard Elementary School, Enterprise Middle School, and Richland High School.
Ownership History
Date
Name
Owned For
Owner Type
Purchase Details
Closed on
Jul 25, 2016
Sold by
Wright Gregory J and Wright Greg J
Bought by
Wright Gregory J and Wright Genna M
Current Estimated Value
Home Financials for this Owner
Home Financials are based on the most recent Mortgage that was taken out on this home.
Original Mortgage
$196,400
Outstanding Balance
$154,879
Interest Rate
3.54%
Mortgage Type
New Conventional
Estimated Equity
$299,107
Purchase Details
Closed on
Sep 16, 2010
Sold by
Alderbrook Homes Llc
Bought by
Wright Greg J
Home Financials for this Owner
Home Financials are based on the most recent Mortgage that was taken out on this home.
Original Mortgage
$229,287
Interest Rate
4.5%
Mortgage Type
FHA
Purchase Details
Closed on
Jun 15, 2010
Sold by
Badger Mountain Village Investments Llc
Bought by
Alderbrook Homes Llc
Home Financials for this Owner
Home Financials are based on the most recent Mortgage that was taken out on this home.
Original Mortgage
$183,200
Interest Rate
4.99%
Mortgage Type
Construction
Create a Home Valuation Report for This Property
The Home Valuation Report is an in-depth analysis detailing your home's value as well as a comparison with similar homes in the area
Home Values in the Area
Average Home Value in this Area
Purchase History
| Date | Buyer | Sale Price | Title Company |
|---|---|---|---|
| Wright Gregory J | -- | None Available | |
| Wright Greg J | $232,376 | Cascade Title | |
| Alderbrook Homes Llc | $45,000 | Cascade Title Co |
Source: Public Records
Mortgage History
| Date | Status | Borrower | Loan Amount |
|---|---|---|---|
| Open | Wright Gregory J | $196,400 | |
| Closed | Wright Greg J | $229,287 | |
| Previous Owner | Alderbrook Homes Llc | $183,200 |
Source: Public Records
Tax History
| Year | Tax Paid | Tax Assessment Tax Assessment Total Assessment is a certain percentage of the fair market value that is determined by local assessors to be the total taxable value of land and additions on the property. | Land | Improvement |
|---|---|---|---|---|
| 2025 | $447 | $459,360 | $85,000 | $374,360 |
| 2024 | $3,686 | $424,120 | $85,000 | $339,120 |
| 2023 | $3,686 | $394,190 | $85,000 | $309,190 |
| 2022 | $3,371 | $334,350 | $85,000 | $249,350 |
| 2021 | $3,284 | $304,430 | $85,000 | $219,430 |
| 2020 | $3,214 | $284,480 | $85,000 | $199,480 |
| 2019 | $2,643 | $263,250 | $48,500 | $214,750 |
| 2018 | $2,743 | $232,570 | $48,500 | $184,070 |
| 2017 | $2,420 | $201,890 | $48,500 | $153,390 |
| 2016 | $2,735 | $201,890 | $48,500 | $153,390 |
| 2015 | $2,662 | $201,890 | $48,500 | $153,390 |
| 2014 | -- | $192,660 | $48,500 | $144,160 |
| 2013 | -- | $192,660 | $48,500 | $144,160 |
Source: Public Records
Map
Nearby Homes
- 1430 Purple Sage St
- 586 Lodi Loop
- 1418 Chardonnay Dr
- 654 Nastacia St
- 664 Punkie Ln
- 1240 Vintage Ave
- 1269 Jubilee St
- 1557 Livorno Ave
- 1359 White Bluffs St
- 1658 Sorrento Ln
- 1716 Manchester St
- 566 Oahu St
- 1634 Verona Ln
- 1352 Westgate Way
- 1953 Gala Way
- 430 Keene Rd
- 1640 Palermo Ave
- 1133 Fairhaven Loop Unit 9
- 1101 Fairhaven Loop
- 1157 Fairhaven Loop Unit 15
- 405 Lakerose Loop
- 409 Lakerose Loop
- 406 Lakerose Loop
- 553 Lakerose Loop
- 549 Lakerose Loop
- 1447 Azalea Ave
- 1443 Azalea Ave
- 410 Lakerose Loop
- 545 Lakerose Loop
- 1451 Azalea Ave
- 413 Lakerose Loop
- 1439 Azalea Ave
- 541 Lakerose Loop
- 414 Lakerose Loop
- 1455 Azalea Ave
- 1435 Azalea Ave Unit Upgraded 2story in d
- 1435 Azalea Ave Unit South Richland!
- 1435 Azalea Ave
- 417 Lakerose Loop
- 537 Lakerose Loop
Your Personal Tour Guide
Ask me questions while you tour the home.