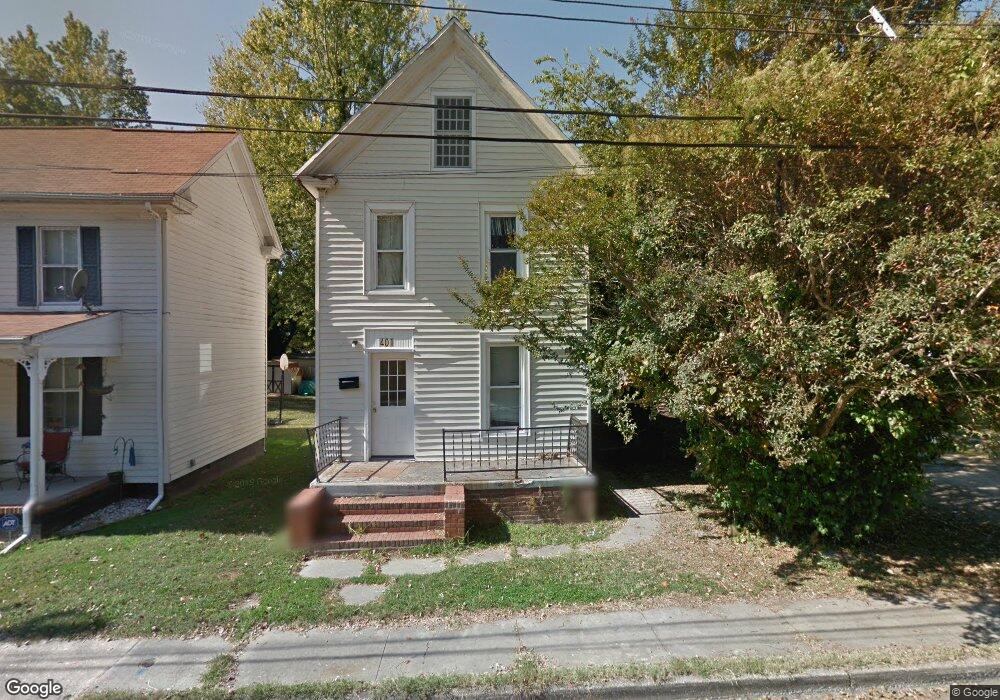
401 Linden Ave Cambridge, MD 21613
Estimated Value: $100,000 - $148,000
Studio
1
Bath
1,356
Sq Ft
$98/Sq Ft
Est. Value
About This Home
This home is located at 401 Linden Ave, Cambridge, MD 21613 and is currently estimated at $132,668, approximately $97 per square foot. 401 Linden Ave is a home located in Dorchester County with nearby schools including Sandy Hill Elementary School, Mace's Lane Middle School, and Cambridge-South Dorchester High School.
Ownership History
Date
Name
Owned For
Owner Type
Purchase Details
Closed on
Mar 3, 2021
Sold by
Spears Michael J
Bought by
Eaw Properties Llc
Current Estimated Value
Purchase Details
Closed on
May 19, 2003
Sold by
Cannon Donald W
Bought by
Hackemeister Charles I
Purchase Details
Closed on
Aug 3, 1998
Sold by
Heine Richard A and Heine Martha N
Bought by
Cannon Donald W and Pamela Katherine
Purchase Details
Closed on
Apr 15, 1988
Sold by
Bradley Patricia Anne
Bought by
Heine Richard A and Heine Martha N
Create a Home Valuation Report for This Property
The Home Valuation Report is an in-depth analysis detailing your home's value as well as a comparison with similar homes in the area
Home Values in the Area
Average Home Value in this Area
Purchase History
| Date | Buyer | Sale Price | Title Company |
|---|---|---|---|
| Eaw Properties Llc | $6,756 | None Listed On Document | |
| Eaw Properties Llc | $6,756 | None Listed On Document | |
| Hackemeister Charles I | $49,000 | -- | |
| Cannon Donald W | $20,000 | -- | |
| Heine Richard A | $17,000 | -- |
Source: Public Records
Tax History
| Year | Tax Paid | Tax Assessment Tax Assessment Total Assessment is a certain percentage of the fair market value that is determined by local assessors to be the total taxable value of land and additions on the property. | Land | Improvement |
|---|---|---|---|---|
| 2025 | $1,103 | $58,700 | $30,200 | $28,500 |
| 2024 | $1,048 | $57,700 | $0 | $0 |
| 2023 | $1,048 | $56,700 | $0 | $0 |
| 2022 | $1,030 | $55,700 | $30,200 | $25,500 |
| 2021 | $924 | $52,333 | $0 | $0 |
| 2020 | $924 | $48,967 | $0 | $0 |
| 2019 | $869 | $45,600 | $21,100 | $24,500 |
| 2018 | $847 | $45,600 | $21,100 | $24,500 |
| 2017 | $1,137 | $45,600 | $0 | $0 |
| 2016 | -- | $61,900 | $0 | $0 |
| 2015 | $1,365 | $61,900 | $0 | $0 |
| 2014 | $1,365 | $61,900 | $0 | $0 |
Source: Public Records
Map
Nearby Homes
- 402 Oakley St
- 817 Locust St
- 0 Edgewood Ave Unit MDDO2010918
- 0 Edgewood Ave Unit MDDO2010930
- 0 Edgewood Ave Unit MDDO2010928
- 0 Edgewood Ave Unit MDDO2010924
- 0 Edgewood Ave Unit MDDO2010926
- 0 Edgewood Ave Unit MDDO2010932
- 409 Oakley St
- 321 Choptank Ave
- 709 Church St
- 307 Willis St
- 1105 Holland Ave
- 430 Leonards Ln
- 314 Belvedere Ave
- 0 Park Ln
- 306 Belvedere Ave
- 211 Choptank Ave
- 832 Park Ln
- 521 Edgewood Ave
Your Personal Tour Guide
Ask me questions while you tour the home.