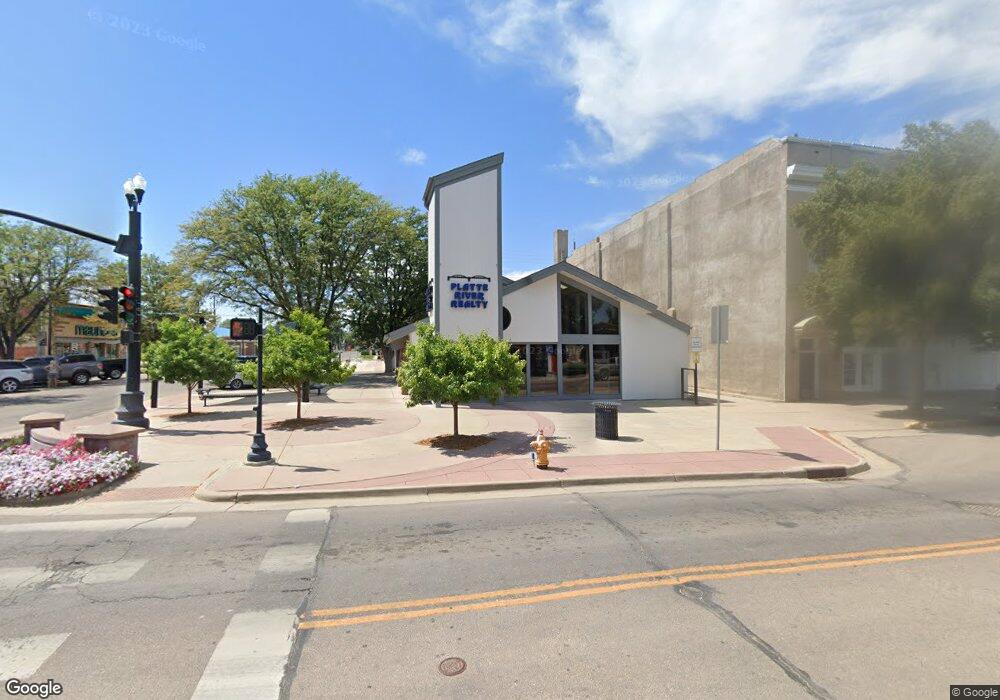
401 Main St Fort Morgan, CO 80701
--
Bed
2
Baths
2,910
Sq Ft
5,227
Sq Ft Lot
About This Home
This home is located at 401 Main St, Fort Morgan, CO 80701. 401 Main St is a home located in Morgan County with nearby schools including Fort Morgan High School, Trinity Lutheran School, and Lighthouse Seventh-day Adventist Christian School.
Ownership History
Date
Name
Owned For
Owner Type
Purchase Details
Closed on
Jan 27, 2022
Sold by
Greene Ron M
Bought by
Reverse S Properties Llc
Home Financials for this Owner
Home Financials are based on the most recent Mortgage that was taken out on this home.
Original Mortgage
$253,593
Outstanding Balance
$219,273
Interest Rate
3.22%
Mortgage Type
New Conventional
Purchase Details
Closed on
Oct 15, 2014
Sold by
Bank Of Colorado
Bought by
Greene Ron M and Greene Gayle
Home Financials for this Owner
Home Financials are based on the most recent Mortgage that was taken out on this home.
Original Mortgage
$161,799
Interest Rate
4.12%
Mortgage Type
Seller Take Back
Create a Home Valuation Report for This Property
The Home Valuation Report is an in-depth analysis detailing your home's value as well as a comparison with similar homes in the area
Home Values in the Area
Average Home Value in this Area
Purchase History
| Date | Buyer | Sale Price | Title Company |
|---|---|---|---|
| Reverse S Properties Llc | $250,000 | None Listed On Document | |
| Greene Ron M | $200,000 | None Available |
Source: Public Records
Mortgage History
| Date | Status | Borrower | Loan Amount |
|---|---|---|---|
| Open | Reverse S Properties Llc | $253,593 | |
| Previous Owner | Greene Ron M | $161,799 |
Source: Public Records
Tax History Compared to Growth
Tax History
| Year | Tax Paid | Tax Assessment Tax Assessment Total Assessment is a certain percentage of the fair market value that is determined by local assessors to be the total taxable value of land and additions on the property. | Land | Improvement |
|---|---|---|---|---|
| 2024 | $5,324 | $66,490 | $10,550 | $55,940 |
| 2023 | $5,324 | $74,860 | $10,550 | $64,310 |
| 2022 | $5,053 | $61,650 | $10,960 | $50,690 |
| 2021 | $5,058 | $61,650 | $10,960 | $50,690 |
| 2020 | $5,682 | $67,390 | $12,760 | $54,630 |
| 2019 | $5,691 | $67,390 | $12,760 | $54,630 |
| 2018 | $5,812 | $67,830 | $12,040 | $55,790 |
| 2017 | $5,819 | $67,830 | $12,040 | $55,790 |
| 2016 | $5,580 | $64,450 | $11,350 | $53,100 |
| 2015 | $5,500 | $64,450 | $11,350 | $53,100 |
| 2014 | $5,917 | $67,620 | $11,790 | $55,830 |
| 2013 | -- | $67,620 | $11,790 | $55,830 |
Source: Public Records
Map
Nearby Homes