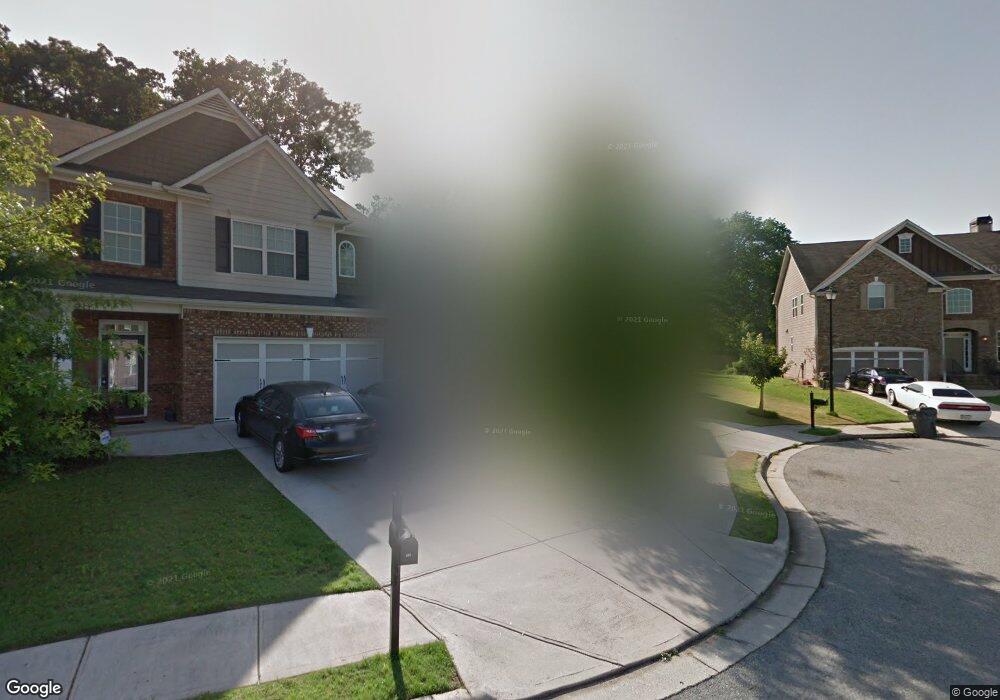
401 Marble Springs Rd Lilburn, GA 30047
Estimated Value: $482,741 - $528,000
4
Beds
3
Baths
3,166
Sq Ft
$160/Sq Ft
Est. Value
About This Home
This home is located at 401 Marble Springs Rd, Lilburn, GA 30047 and is currently estimated at $506,435, approximately $159 per square foot. 401 Marble Springs Rd is a home located in Gwinnett County with nearby schools including Minor Elementary School, Berkmar Middle School, and Berkmar High School.
Ownership History
Date
Name
Owned For
Owner Type
Purchase Details
Closed on
Nov 30, 2020
Sold by
Rasheed Abdul
Bought by
Rasheed Abdul and Rasheed Tasneem Sajida
Current Estimated Value
Home Financials for this Owner
Home Financials are based on the most recent Mortgage that was taken out on this home.
Original Mortgage
$65,000
Outstanding Balance
$47,282
Interest Rate
2.8%
Mortgage Type
New Conventional
Estimated Equity
$459,153
Purchase Details
Closed on
Aug 5, 2019
Sold by
Rasheed Abdul
Bought by
Rasheed Abdul and Rasheed Tasneem Sajida
Home Financials for this Owner
Home Financials are based on the most recent Mortgage that was taken out on this home.
Original Mortgage
$152,000
Interest Rate
3.7%
Mortgage Type
New Conventional
Purchase Details
Closed on
Jan 31, 2006
Sold by
Winmark Homes Inc
Bought by
Rasheed Abdul and Tasneem Sajida
Home Financials for this Owner
Home Financials are based on the most recent Mortgage that was taken out on this home.
Original Mortgage
$207,684
Interest Rate
6.14%
Mortgage Type
Trade
Create a Home Valuation Report for This Property
The Home Valuation Report is an in-depth analysis detailing your home's value as well as a comparison with similar homes in the area
Home Values in the Area
Average Home Value in this Area
Purchase History
| Date | Buyer | Sale Price | Title Company |
|---|---|---|---|
| Rasheed Abdul | -- | -- | |
| Rasheed Abdul | -- | -- | |
| Rasheed Abdul | $259,700 | -- |
Source: Public Records
Mortgage History
| Date | Status | Borrower | Loan Amount |
|---|---|---|---|
| Open | Rasheed Abdul | $65,000 | |
| Previous Owner | Rasheed Abdul | $152,000 | |
| Previous Owner | Rasheed Abdul | $207,684 |
Source: Public Records
Tax History Compared to Growth
Tax History
| Year | Tax Paid | Tax Assessment Tax Assessment Total Assessment is a certain percentage of the fair market value that is determined by local assessors to be the total taxable value of land and additions on the property. | Land | Improvement |
|---|---|---|---|---|
| 2024 | $1,847 | $190,640 | $24,000 | $166,640 |
| 2023 | $1,847 | $181,040 | $32,000 | $149,040 |
| 2022 | $0 | $141,160 | $28,000 | $113,160 |
| 2021 | $1,796 | $122,280 | $23,600 | $98,680 |
| 2020 | $4,219 | $122,280 | $23,600 | $98,680 |
| 2019 | $3,968 | $117,560 | $23,600 | $93,960 |
| 2018 | $3,819 | $110,320 | $20,800 | $89,520 |
| 2016 | $3,654 | $101,240 | $18,000 | $83,240 |
| 2015 | $2,644 | $71,600 | $12,000 | $59,600 |
| 2014 | -- | $71,600 | $12,000 | $59,600 |
Source: Public Records
Map
Nearby Homes
- 4082 Johns St NW
- 0 Lawrenceville Hwy NW Unit 7662367
- 0 Lawrenceville Hwy NW Unit 10618125
- 566 Jody Place
- 4100 Bradstone Trace NW Unit 1
- 642 Huntington Way NW
- 3975 Bradstone Trace NW
- 4450 Bradstone Trace NW Unit 2
- 4080 Landress Park Dr NW Unit 1
- 3911 Millwood Ln NW
- 3951 Millwood Ln NW
- 1118 Saybrook Cir NW
- 881 Huntington Way NW
- 3706 Charles St NW
- 495 Tambec Trace NW Unit 2
- 918 Hampton Trail NW
- 4452 Burns Rd NW
- 805 Pleasant Hill Rd NW Unit 212
- 805 Pleasant Hill Rd NW Unit 703
- 411 Marble Springs Rd
- 391 Marble Springs Rd
- 391 Marble Springs Rd NW
- 4123 Johns St NW
- 4123 John St NW
- 421 Marble Springs Rd
- 381 Marble Springs Rd
- 390 Marble Springs Rd
- 4113 Johns St NW Unit 2
- 431 Marble Springs Rd
- 371 Marble Springs Rd
- 4128 Pebble Pointe Ln
- 360 Marble Springs Rd
- 0 Pebble Pointe Ln Unit 7290240
- 0 Pebble Pointe Ln Unit 7266495
- 0 Pebble Pointe Ln Unit 8607359
- 0 Pebble Pointe Ln Unit 8393240
- 0 Pebble Pointe Ln Unit 8656672
- 0 Pebble Pointe Ln Unit 8315397
- 0 Pebble Pointe Ln