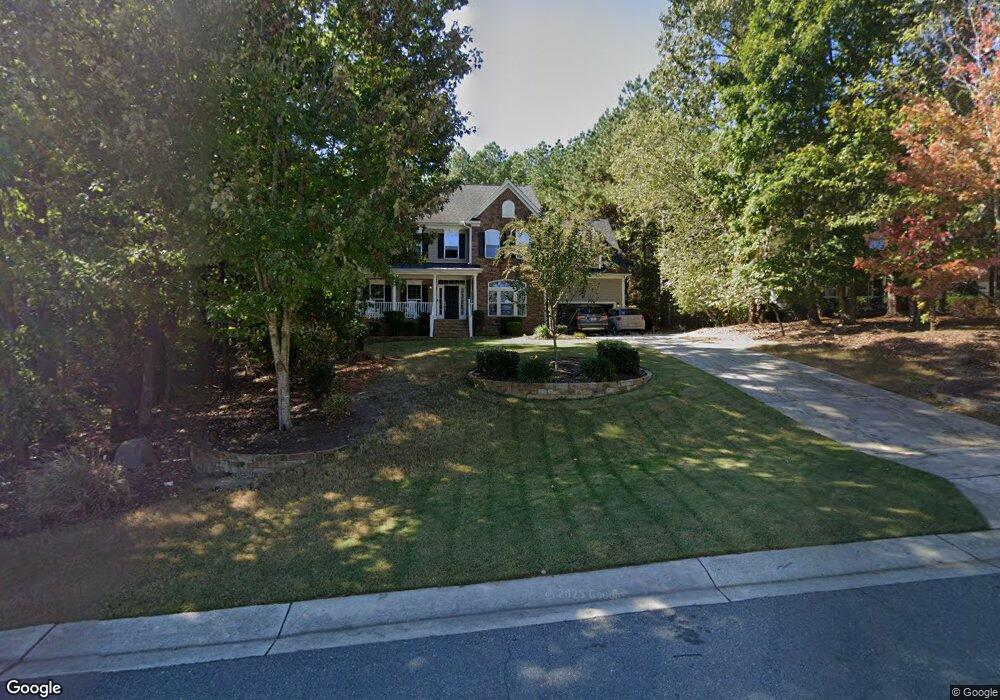
401 Middlegame Way Wake Forest, NC 27587
Estimated Value: $653,000 - $727,000
4
Beds
3
Baths
3,773
Sq Ft
$187/Sq Ft
Est. Value
About This Home
This home is located at 401 Middlegame Way, Wake Forest, NC 27587 and is currently estimated at $704,821, approximately $186 per square foot. 401 Middlegame Way is a home located in Wake County with nearby schools including Richland Creek Elementary School, Wake Forest-Rolesville Middle School, and Wake Forest High School.
Ownership History
Date
Name
Owned For
Owner Type
Purchase Details
Closed on
Jul 28, 2017
Sold by
Shah Gaurang K and Shah Minal G
Bought by
Nelson Jennifer E
Current Estimated Value
Home Financials for this Owner
Home Financials are based on the most recent Mortgage that was taken out on this home.
Original Mortgage
$353,000
Outstanding Balance
$294,153
Interest Rate
3.91%
Mortgage Type
New Conventional
Estimated Equity
$410,668
Purchase Details
Closed on
Sep 28, 2012
Sold by
Shah Guarang and Shah Minal
Bought by
Shah Gauragn K and Patel Dhananjya K
Home Financials for this Owner
Home Financials are based on the most recent Mortgage that was taken out on this home.
Original Mortgage
$276,000
Interest Rate
3.68%
Mortgage Type
New Conventional
Purchase Details
Closed on
Feb 15, 2012
Sold by
Contentnea Creek Development Company
Bought by
Nvr Inc and Ryan Homes
Create a Home Valuation Report for This Property
The Home Valuation Report is an in-depth analysis detailing your home's value as well as a comparison with similar homes in the area
Home Values in the Area
Average Home Value in this Area
Purchase History
| Date | Buyer | Sale Price | Title Company |
|---|---|---|---|
| Nelson Jennifer E | $393,000 | None Available | |
| Shah Gauragn K | -- | None Available | |
| Shah Gaurang | $345,000 | None Available | |
| Nvr Inc | $62,000 | None Available |
Source: Public Records
Mortgage History
| Date | Status | Borrower | Loan Amount |
|---|---|---|---|
| Open | Nelson Jennifer E | $353,000 | |
| Previous Owner | Shah Gaurang | $276,000 |
Source: Public Records
Tax History
| Year | Tax Paid | Tax Assessment Tax Assessment Total Assessment is a certain percentage of the fair market value that is determined by local assessors to be the total taxable value of land and additions on the property. | Land | Improvement |
|---|---|---|---|---|
| 2025 | $6,221 | $648,795 | $130,000 | $518,795 |
| 2024 | $6,308 | $648,795 | $130,000 | $518,795 |
Source: Public Records
Map
Nearby Homes
- 332 Kings Glen Way
- 1401 Endgame Ct
- 117 Dry Gully Ct
- 1825 Armor Crest Ln
- 1609 Frog Hollow Way
- 617 Dixon House Ct
- 509 Morning Glade St
- 1665 Fern Hollow Trail
- 1632 Sterling Lake Dr
- 504 Sun Meadow Dr
- 1736 Fern Hollow Trail
- 813 Copper Beech Ln
- 2001 Latham Oaks Ave
- 621 Sun Meadow Dr
- 1709 Glazebrook Dr
- 1409 Sterling Lake Dr
- 1837 Longmont Dr
- 1824 Longmont Dr
- 1120 Sun Springs Rd
- 1116 Sun Springs Rd
- 405 Middlegame Way
- 408 Gambit Cir
- 409 Middlegame Way
- 404 Gambit Cir
- 412 Gambit Cir
- 1717 Castling Ct
- 1701 Grandmaster Way
- 1703 Grandmaster Way
- 1713 Castling Ct
- 416 Gambit Cir
- 413 Middlegame Way
- 1707 Grandmaster Way
- 400 Gambit Cir
- 420 Gambit Cir
- 1711 Grandmaster Way
- 417 Middlegame Way
- 1721 Castling Ct
- 1713 Grandmaster Way
- 1715 Grandmaster Way
- 413 Gambit Cir
Your Personal Tour Guide
Ask me questions while you tour the home.