S
Seller's Agent in 2025
Sheila McDougall
Leading Edge Real Estate

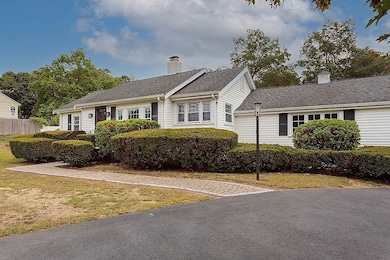
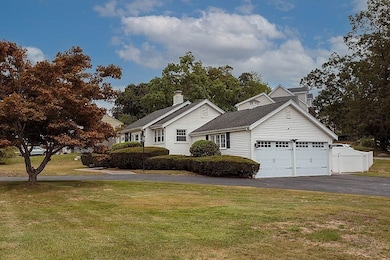
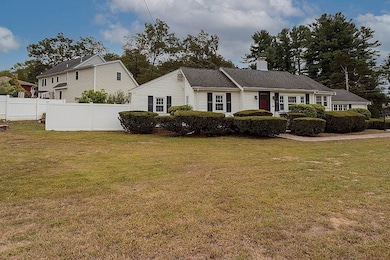
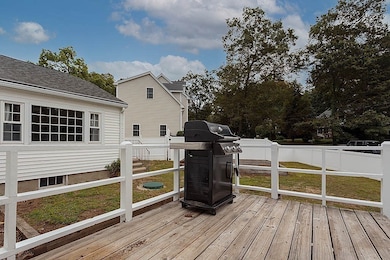
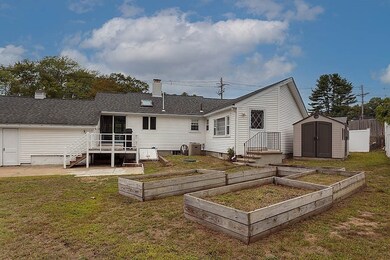
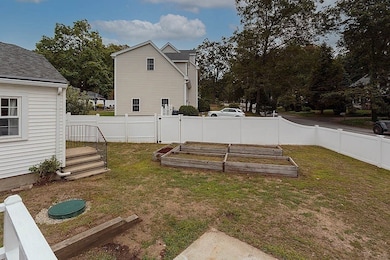
Welcome to this fantastic 3-bedroom, 1.5-bath ranch nestled in a sought-after North Wilmington neighborhood. Perfectly positioned within walking distance to the commuter rail with direct access to Boston, this home offers the ideal blend of comfort and convenience. The spacious living and dining areas provide ample space for both relaxing and entertaining. The kitchen offers plenty of cabinetry and potential for your personal touch. The interior does need some updating but the major improvements have been done, roof, some windows, heating and cooling. Outside, enjoy a fully fenced backyard—perfect for pets, play, or gardening—and a large, attached 2-car garage with additional storage. This single-level home provides easy living making it a great option for first-time buyers, or down sizers.Don't miss this opportunity to own a solid home in a commuter-friendly neighborhood.
Last Agent to Sell the Property
Sheila McDougall
Leading Edge Real Estate Listed on: 09/03/2025

| Date | Type | Sale Price | Title Company |
|---|---|---|---|
| Quit Claim Deed | $575,000 | -- | |
| Quit Claim Deed | -- | -- | |
| Quit Claim Deed | -- | -- | |
| Deed | $270,000 | -- | |
| Deed | $270,000 | -- | |
| Deed | $342,500 | -- | |
| Deed | $342,500 | -- |
| Date | Status | Loan Amount | Loan Type |
|---|---|---|---|
| Open | $445,000 | Purchase Money Mortgage | |
| Previous Owner | $25,000 | No Value Available | |
| Previous Owner | $155,000 | Purchase Money Mortgage |
| Date | Event | Price | List to Sale | Price per Sq Ft |
|---|---|---|---|---|
| 10/16/2025 10/16/25 | Sold | $575,000 | +9.5% | $474 / Sq Ft |
| 09/10/2025 09/10/25 | Pending | -- | -- | -- |
| 09/03/2025 09/03/25 | For Sale | $525,000 | -- | $432 / Sq Ft |
| Year | Tax Paid | Tax Assessment Tax Assessment Total Assessment is a certain percentage of the fair market value that is determined by local assessors to be the total taxable value of land and additions on the property. | Land | Improvement |
|---|---|---|---|---|
| 2025 | $6,018 | $525,600 | $259,400 | $266,200 |
| 2024 | $5,772 | $505,000 | $259,400 | $245,600 |
| 2023 | $5,603 | $469,300 | $235,800 | $233,500 |
| 2022 | $5,336 | $409,500 | $196,500 | $213,000 |
| 2021 | $5,346 | $386,300 | $178,600 | $207,700 |
| 2020 | $5,076 | $373,800 | $178,600 | $195,200 |
| 2019 | $5,027 | $365,600 | $170,100 | $195,500 |
| 2018 | $4,675 | $324,400 | $162,000 | $162,400 |
| 2017 | $4,422 | $306,000 | $155,100 | $150,900 |
| 2016 | $4,235 | $289,500 | $147,800 | $141,700 |
| 2015 | $3,995 | $278,000 | $147,800 | $130,200 |
| 2014 | $3,711 | $260,600 | $140,700 | $119,900 |
S
Seller's Agent in 2025
Sheila McDougall
Leading Edge Real Estate
M
Buyer's Agent in 2025
Madelyn Farrell
J. Mulkerin Realty
1 in this area
15 Total Sales
Source: MLS Property Information Network (MLS PIN)
MLS Number: 73421903
APN: WILM-000088-000000-000000-000086
Disclaimer: Certain information contained herein is derived from information provided by parties other than Homes.com. All information provided is deemed reliable, but is not guaranteed to be accurate and should be independently verified.
![]() The property listing data and information, or the Images, set forth herein were provided to MLS Property Information Network, Inc. from third party sources, including sellers, lessors and public records, and were compiled by MLS Property Information Network, Inc. The property listing data and information, and the Images, are for the personal, non-commercial use of consumers having a good faith interest in purchasing or leasing listed properties of the type displayed to them and may not be used for any purpose other than to identify prospective properties which such consumers may have a good faith interest in purchasing or leasing. MLS Property Information Network, Inc. and its subscribers disclaim any and all representations and warranties as to the accuracy of the property listing data and information, or as to the accuracy of any of the Images, set forth herein.
The property listing data and information, or the Images, set forth herein were provided to MLS Property Information Network, Inc. from third party sources, including sellers, lessors and public records, and were compiled by MLS Property Information Network, Inc. The property listing data and information, and the Images, are for the personal, non-commercial use of consumers having a good faith interest in purchasing or leasing listed properties of the type displayed to them and may not be used for any purpose other than to identify prospective properties which such consumers may have a good faith interest in purchasing or leasing. MLS Property Information Network, Inc. and its subscribers disclaim any and all representations and warranties as to the accuracy of the property listing data and information, or as to the accuracy of any of the Images, set forth herein.
Ask me questions while you tour the home.