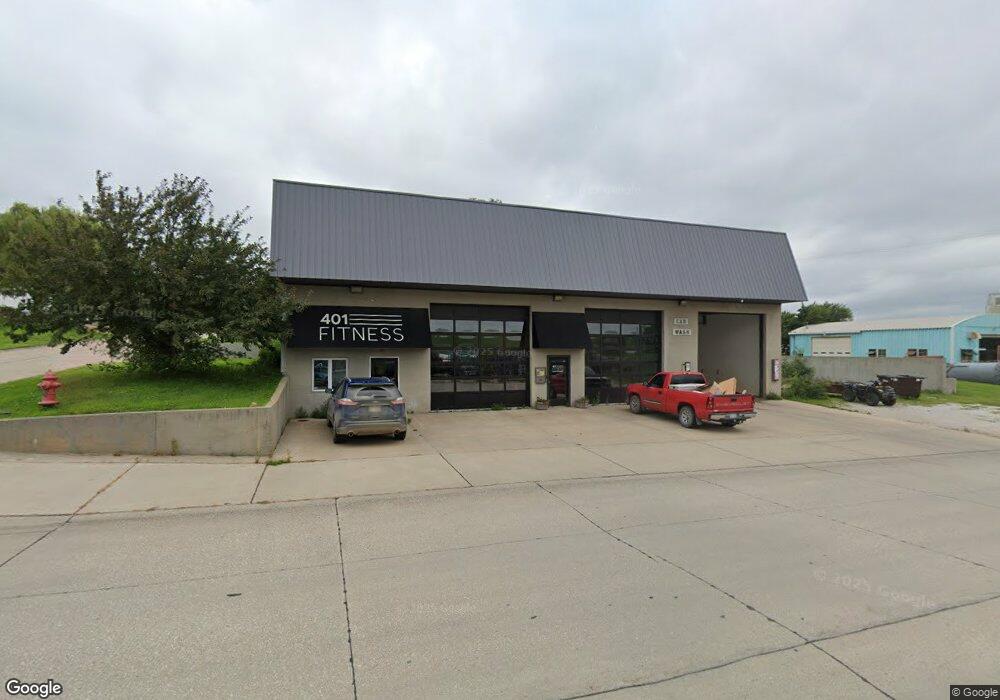
401 N 3rd St Humphrey, NE 68642
Estimated Value: $267,772
--
Bed
--
Bath
3,800
Sq Ft
$70/Sq Ft
Est. Value
About This Home
This home is located at 401 N 3rd St, Humphrey, NE 68642 and is currently estimated at $267,772, approximately $70 per square foot. 401 N 3rd St is a home located in Platte County with nearby schools including Humphrey Elementary School, Lindsay Attendance Center, and Humphrey Junior/Senior High School.
Ownership History
Date
Name
Owned For
Owner Type
Purchase Details
Closed on
Aug 17, 2017
Sold by
Dittberner Hildagard and Dittberner Jack T
Bought by
Helmer Juston D
Current Estimated Value
Purchase Details
Closed on
Oct 23, 2013
Bought by
Dittberner Hildagard
Purchase Details
Closed on
Nov 29, 2010
Sold by
Sunderman Paul Mark
Bought by
Dittherner Hildagard
Purchase Details
Closed on
May 9, 2008
Sold by
Hastreiter John F and Hastreiter Cheryl A
Bought by
Sunderman Paul Mark
Create a Home Valuation Report for This Property
The Home Valuation Report is an in-depth analysis detailing your home's value as well as a comparison with similar homes in the area
Home Values in the Area
Average Home Value in this Area
Purchase History
| Date | Buyer | Sale Price | Title Company |
|---|---|---|---|
| Helmer Juston D | $160,000 | None Available | |
| Dittberner Hildagard | -- | -- | |
| Dittherner Hildagard | -- | -- | |
| Sunderman Paul Mark | $125,000 | -- |
Source: Public Records
Tax History Compared to Growth
Tax History
| Year | Tax Paid | Tax Assessment Tax Assessment Total Assessment is a certain percentage of the fair market value that is determined by local assessors to be the total taxable value of land and additions on the property. | Land | Improvement |
|---|---|---|---|---|
| 2024 | $1,884 | $201,175 | $24,000 | $177,175 |
| 2023 | $1,669 | $142,500 | $14,300 | $128,200 |
| 2022 | $1,767 | $142,500 | $14,300 | $128,200 |
| 2021 | $1,853 | $142,500 | $14,300 | $128,200 |
| 2020 | $1,856 | $142,500 | $14,300 | $128,200 |
| 2019 | $1,843 | $142,500 | $14,300 | $128,200 |
| 2018 | $1,257 | $99,750 | $14,300 | $85,450 |
| 2017 | $1,245 | $99,750 | $14,300 | $85,450 |
| 2016 | $1,194 | $99,750 | $14,300 | $85,450 |
| 2015 | $1,205 | $99,750 | $14,300 | $85,450 |
| 2014 | $1,309 | $99,750 | $14,300 | $85,450 |
| 2012 | -- | $135,375 | $14,300 | $121,075 |
Source: Public Records
Map
Nearby Homes