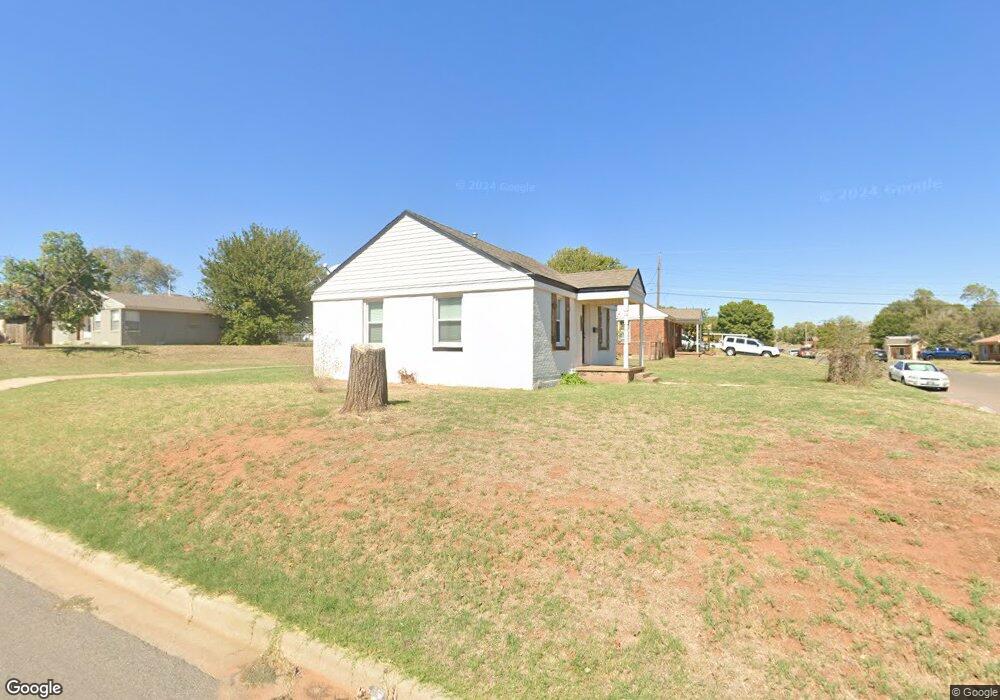
401 N 4th St Weatherford, OK 73096
Estimated Value: $91,000 - $116,000
2
Beds
1
Bath
725
Sq Ft
$137/Sq Ft
Est. Value
About This Home
This home is located at 401 N 4th St, Weatherford, OK 73096 and is currently estimated at $99,338, approximately $137 per square foot. 401 N 4th St is a home located in Custer County with nearby schools including Burcham Elementary School, Weatherford West Elementary School, and Lt. General Thomas P. Stafford Elementary School.
Ownership History
Date
Name
Owned For
Owner Type
Purchase Details
Closed on
Mar 30, 2022
Sold by
Penner Delbert and Penner Patricia
Bought by
Chavez Armando
Current Estimated Value
Home Financials for this Owner
Home Financials are based on the most recent Mortgage that was taken out on this home.
Original Mortgage
$67,150
Outstanding Balance
$57,987
Interest Rate
2.86%
Mortgage Type
Construction
Estimated Equity
$41,351
Purchase Details
Closed on
Feb 28, 1997
Sold by
Vester G Kliewer
Bought by
Delbert Penner
Create a Home Valuation Report for This Property
The Home Valuation Report is an in-depth analysis detailing your home's value as well as a comparison with similar homes in the area
Home Values in the Area
Average Home Value in this Area
Purchase History
| Date | Buyer | Sale Price | Title Company |
|---|---|---|---|
| Chavez Armando | $79,000 | Old Republic Title Co Ok | |
| Delbert Penner | $20,000 | -- |
Source: Public Records
Mortgage History
| Date | Status | Borrower | Loan Amount |
|---|---|---|---|
| Open | Chavez Armando | $67,150 |
Source: Public Records
Tax History Compared to Growth
Tax History
| Year | Tax Paid | Tax Assessment Tax Assessment Total Assessment is a certain percentage of the fair market value that is determined by local assessors to be the total taxable value of land and additions on the property. | Land | Improvement |
|---|---|---|---|---|
| 2025 | $712 | $6,533 | $481 | $6,052 |
| 2024 | $712 | $7,222 | $481 | $6,741 |
| 2023 | $712 | $8,690 | $481 | $8,209 |
| 2022 | $361 | $3,749 | $481 | $3,268 |
| 2021 | $363 | $3,749 | $481 | $3,268 |
| 2020 | $378 | $3,749 | $481 | $3,268 |
| 2019 | $387 | $3,797 | $290 | $3,507 |
| 2018 | $335 | $3,616 | $293 | $3,323 |
| 2017 | $325 | $3,444 | $330 | $3,114 |
| 2016 | $312 | $3,280 | $326 | $2,954 |
| 2015 | $302 | $3,124 | $375 | $2,749 |
| 2014 | $286 | $2,975 | $371 | $2,604 |
Source: Public Records
Map
Nearby Homes