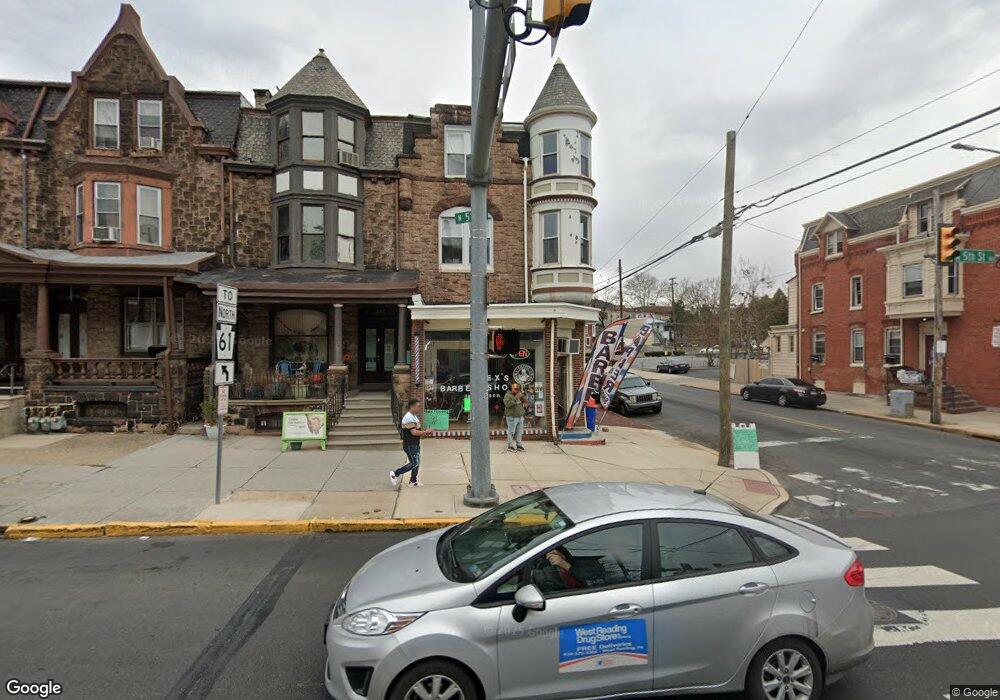
401 N 5th St Reading, PA 19601
Reading City Center NeighborhoodEstimated Value: $489,331
--
Bed
--
Bath
4,533
Sq Ft
$108/Sq Ft
Est. Value
About This Home
This home is located at 401 N 5th St, Reading, PA 19601 and is currently estimated at $489,331, approximately $107 per square foot. 401 N 5th St is a home located in Berks County with nearby schools including Lauer's Park Elementary School, Southwest Middle School, and Reading Senior High School.
Ownership History
Date
Name
Owned For
Owner Type
Purchase Details
Closed on
Jul 6, 2017
Sold by
Angelo Pagnotti Inc
Bought by
5Th Street Investment Properties Llc
Current Estimated Value
Home Financials for this Owner
Home Financials are based on the most recent Mortgage that was taken out on this home.
Original Mortgage
$131,250
Outstanding Balance
$109,047
Interest Rate
3.89%
Mortgage Type
Future Advance Clause Open End Mortgage
Estimated Equity
$380,284
Purchase Details
Closed on
Jun 14, 2005
Sold by
Berks County Mortgage Co Inc
Bought by
Angelo Pagnotti Inc
Home Financials for this Owner
Home Financials are based on the most recent Mortgage that was taken out on this home.
Original Mortgage
$135,120
Interest Rate
5.68%
Mortgage Type
Commercial
Create a Home Valuation Report for This Property
The Home Valuation Report is an in-depth analysis detailing your home's value as well as a comparison with similar homes in the area
Home Values in the Area
Average Home Value in this Area
Purchase History
| Date | Buyer | Sale Price | Title Company |
|---|---|---|---|
| 5Th Street Investment Properties Llc | $175,000 | None Available | |
| Angelo Pagnotti Inc | $168,900 | -- |
Source: Public Records
Mortgage History
| Date | Status | Borrower | Loan Amount |
|---|---|---|---|
| Open | 5Th Street Investment Properties Llc | $131,250 | |
| Previous Owner | Angelo Pagnotti Inc | $135,120 |
Source: Public Records
Tax History Compared to Growth
Tax History
| Year | Tax Paid | Tax Assessment Tax Assessment Total Assessment is a certain percentage of the fair market value that is determined by local assessors to be the total taxable value of land and additions on the property. | Land | Improvement |
|---|---|---|---|---|
| 2025 | $1,897 | $69,900 | $37,200 | $32,700 |
| 2024 | $3,104 | $69,900 | $37,200 | $32,700 |
| 2023 | $3,056 | $69,900 | $37,200 | $32,700 |
| 2022 | $3,056 | $69,900 | $37,200 | $32,700 |
| 2021 | $3,056 | $69,900 | $37,200 | $32,700 |
| 2020 | $3,025 | $69,900 | $37,200 | $32,700 |
| 2019 | $3,025 | $69,900 | $37,200 | $32,700 |
| 2018 | $3,025 | $69,900 | $37,200 | $32,700 |
| 2017 | $3,005 | $69,900 | $37,200 | $32,700 |
| 2016 | $1,717 | $69,900 | $37,200 | $32,700 |
| 2015 | $1,717 | $69,900 | $37,200 | $32,700 |
| 2014 | $1,580 | $69,900 | $37,200 | $32,700 |
Source: Public Records
Map
Nearby Homes