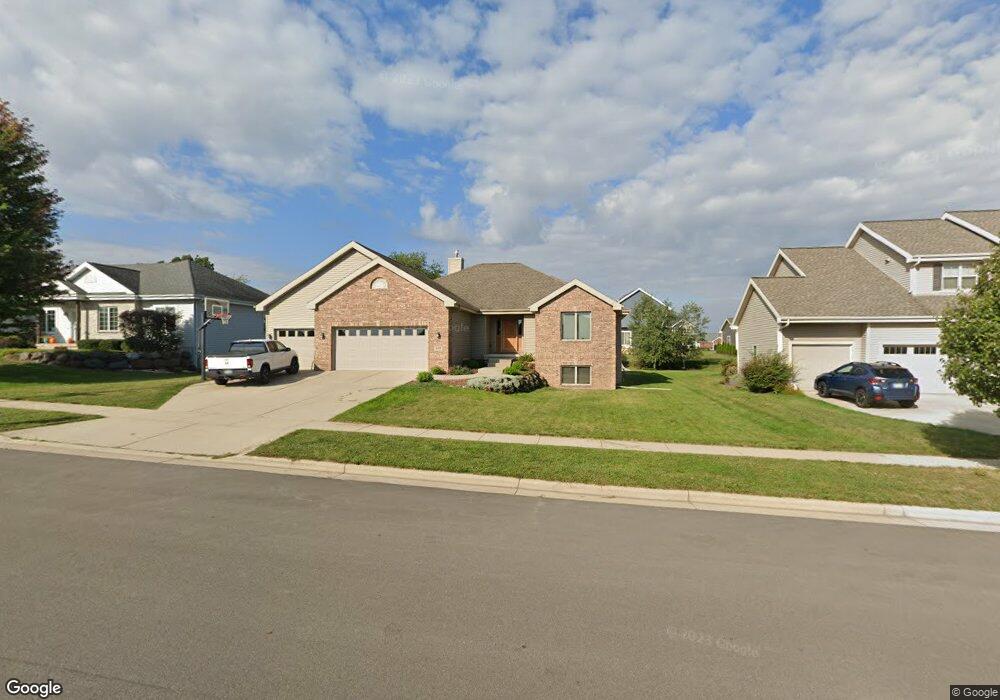
401 N Bergamont Blvd Oregon, WI 53575
Estimated Value: $713,000 - $804,000
4
Beds
4
Baths
4,046
Sq Ft
$190/Sq Ft
Est. Value
About This Home
This home is located at 401 N Bergamont Blvd, Oregon, WI 53575 and is currently estimated at $768,777, approximately $190 per square foot. 401 N Bergamont Blvd is a home located in Dane County with nearby schools including Rome Corners Intermediate School, Oregon Middle School, and Oregon High School.
Ownership History
Date
Name
Owned For
Owner Type
Purchase Details
Closed on
Jul 1, 2011
Sold by
Sans Timothy J and Sans Lesley A
Bought by
Rulseh John P and Rulseh Lori K
Current Estimated Value
Home Financials for this Owner
Home Financials are based on the most recent Mortgage that was taken out on this home.
Original Mortgage
$296,000
Outstanding Balance
$204,789
Interest Rate
4.63%
Mortgage Type
New Conventional
Estimated Equity
$563,988
Purchase Details
Closed on
Aug 27, 2008
Sold by
Anderson Premier Homes
Bought by
Sans Lesley A and Sans Timothy J
Home Financials for this Owner
Home Financials are based on the most recent Mortgage that was taken out on this home.
Original Mortgage
$349,600
Interest Rate
6.66%
Mortgage Type
Purchase Money Mortgage
Purchase Details
Closed on
Jun 23, 2005
Sold by
Oregon Parks Llc
Bought by
Anderson Premier Homes
Create a Home Valuation Report for This Property
The Home Valuation Report is an in-depth analysis detailing your home's value as well as a comparison with similar homes in the area
Home Values in the Area
Average Home Value in this Area
Purchase History
| Date | Buyer | Sale Price | Title Company |
|---|---|---|---|
| Rulseh John P | $370,000 | None Available | |
| Sans Lesley A | $368,000 | None Available | |
| Anderson Premier Homes | $84,000 | None Available |
Source: Public Records
Mortgage History
| Date | Status | Borrower | Loan Amount |
|---|---|---|---|
| Open | Rulseh John P | $296,000 | |
| Previous Owner | Sans Lesley A | $349,600 |
Source: Public Records
Tax History Compared to Growth
Tax History
| Year | Tax Paid | Tax Assessment Tax Assessment Total Assessment is a certain percentage of the fair market value that is determined by local assessors to be the total taxable value of land and additions on the property. | Land | Improvement |
|---|---|---|---|---|
| 2024 | $10,513 | $632,500 | $117,500 | $515,000 |
| 2023 | $10,152 | $632,500 | $117,500 | $515,000 |
| 2021 | $9,038 | $518,100 | $100,200 | $417,900 |
| 2020 | $9,026 | $497,300 | $100,200 | $397,100 |
| 2019 | $9,016 | $497,300 | $100,200 | $397,100 |
| 2018 | $8,468 | $459,200 | $100,200 | $359,000 |
| 2017 | $8,265 | $436,800 | $84,600 | $352,200 |
| 2016 | $7,990 | $411,100 | $84,600 | $326,500 |
| 2015 | $7,952 | $404,300 | $84,600 | $319,700 |
| 2014 | $7,553 | $385,400 | $84,600 | $300,800 |
| 2013 | $7,015 | $370,000 | $84,600 | $285,400 |
Source: Public Records
Map
Nearby Homes
- 315 Liberty Park Dr
- 1226 Denmark Cir Unit 49
- 1226 Denmark Cir
- 1248 Denmark Cir Unit 46
- Ridgefield Plan at Highlands of Netherwood
- Rutherford II Plan at Highlands of Netherwood
- Meadowlark Plan at Highlands of Netherwood
- Siena II Plan at Highlands of Netherwood
- Wren Plan at Highlands of Netherwood
- Starling Plan at Highlands of Netherwood
- Townsend Plan at Highlands of Netherwood
- Raleigh Plan at Highlands of Netherwood
- 1214 Denmark Cir Unit 50
- 1214 Denmark Cir
- 1247 Denmark Cir Unit 38
- 1251 Denmark Cir Unit 39
- 1265 Denmark Cir Unit 40
- 1256 Denmark Cir Unit 45
- 1201 Tivoli Cir
- 1257 Tivoli Cir
- 405 N Bergamont Blvd
- 397 N Bergamont Blvd
- 432 Peterson Trail
- 432 Peterson Trail
- 393 N Bergamont Blvd
- 438 Peterson Tr
- 411 N Bergamont Blvd
- 444 Peterson Trail
- 426 Peterson Trail
- 400 N Bergamont Blvd
- 404 N Bergamont Blvd
- 389 N Bergamont Blvd
- 398 N Bergamont Blvd
- 418 Peterson Trail
- 435 Peterson Trail
- 392 N Bergamont Blvd
- 981 Halcyon Days Ct
- 423 Peterson Trail
- 385 N Bergamont Blvd
- 386 N Bergamont Blvd