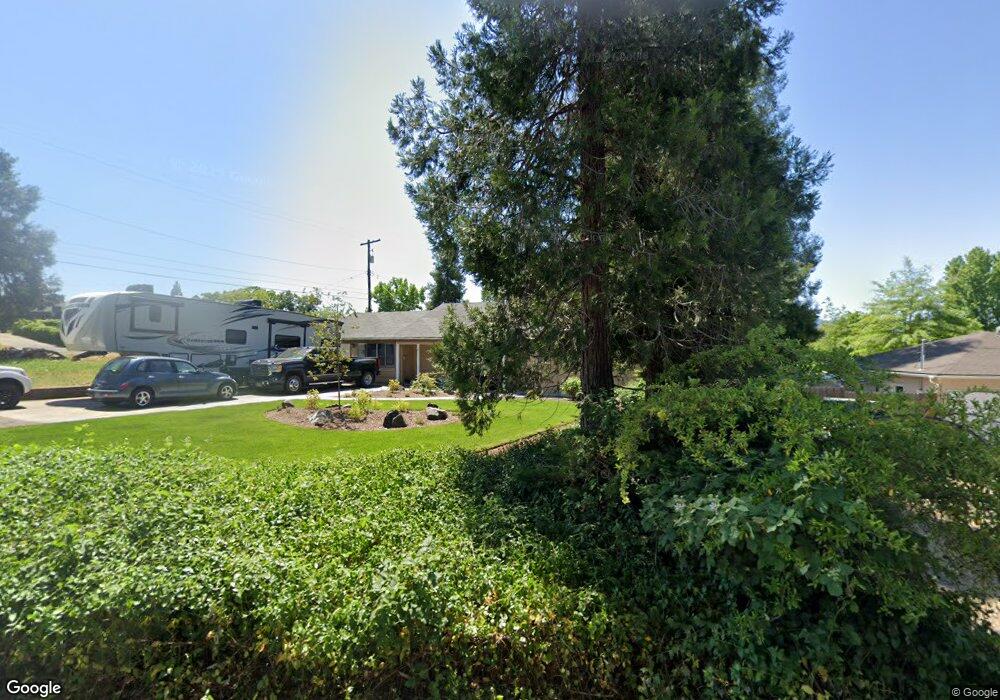
401 N Keene Way Dr Medford, OR 97504
Estimated Value: $364,000 - $403,000
3
Beds
2
Baths
1,545
Sq Ft
$248/Sq Ft
Est. Value
About This Home
This home is located at 401 N Keene Way Dr, Medford, OR 97504 and is currently estimated at $383,276, approximately $248 per square foot. 401 N Keene Way Dr is a home located in Jackson County with nearby schools including Roosevelt Elementary School, Hedrick Middle School, and North Medford High School.
Ownership History
Date
Name
Owned For
Owner Type
Purchase Details
Closed on
Jul 25, 2019
Sold by
Bailey Timothy R
Bought by
Bailey Timothy
Current Estimated Value
Home Financials for this Owner
Home Financials are based on the most recent Mortgage that was taken out on this home.
Original Mortgage
$296,960
Outstanding Balance
$260,163
Interest Rate
3.82%
Mortgage Type
VA
Estimated Equity
$123,113
Purchase Details
Closed on
Jun 30, 2008
Sold by
Bailey Timothy Ronald and Bailey Kimberly Dawn
Bought by
Bailey Timothy R
Home Financials for this Owner
Home Financials are based on the most recent Mortgage that was taken out on this home.
Original Mortgage
$212,000
Interest Rate
6%
Mortgage Type
New Conventional
Purchase Details
Closed on
Oct 21, 1999
Sold by
Va
Bought by
Toney Denis E
Home Financials for this Owner
Home Financials are based on the most recent Mortgage that was taken out on this home.
Original Mortgage
$92,000
Interest Rate
8.99%
Purchase Details
Closed on
Jun 4, 1999
Sold by
White John C and White Darlene M
Bought by
Chase Mtg Services Inc
Create a Home Valuation Report for This Property
The Home Valuation Report is an in-depth analysis detailing your home's value as well as a comparison with similar homes in the area
Home Values in the Area
Average Home Value in this Area
Purchase History
| Date | Buyer | Sale Price | Title Company |
|---|---|---|---|
| Bailey Timothy | -- | First American Title | |
| Bailey Timothy R | -- | Lawyers Title Ins | |
| Toney Denis E | $115,025 | Amerititle | |
| Chase Mtg Services Inc | $99,682 | Amerititle |
Source: Public Records
Mortgage History
| Date | Status | Borrower | Loan Amount |
|---|---|---|---|
| Open | Bailey Timothy | $296,960 | |
| Closed | Bailey Timothy R | $212,000 | |
| Closed | Toney Denis E | $92,000 | |
| Closed | Toney Denis E | $23,000 |
Source: Public Records
Tax History Compared to Growth
Tax History
| Year | Tax Paid | Tax Assessment Tax Assessment Total Assessment is a certain percentage of the fair market value that is determined by local assessors to be the total taxable value of land and additions on the property. | Land | Improvement |
|---|---|---|---|---|
| 2025 | $3,265 | $209,010 | $88,080 | $120,930 |
| 2024 | $3,265 | $202,930 | $85,510 | $117,420 |
| 2023 | $2,938 | $197,020 | $83,020 | $114,000 |
| 2022 | $2,867 | $197,020 | $83,020 | $114,000 |
| 2021 | $2,932 | $191,290 | $80,610 | $110,680 |
| 2020 | $2,734 | $185,720 | $78,260 | $107,460 |
| 2019 | $2,669 | $175,070 | $73,780 | $101,290 |
| 2018 | $2,601 | $169,980 | $71,640 | $98,340 |
| 2017 | $2,554 | $169,980 | $71,640 | $98,340 |
| 2016 | $2,571 | $160,230 | $67,520 | $92,710 |
| 2015 | $2,471 | $160,230 | $67,520 | $92,710 |
| 2014 | $2,427 | $151,040 | $63,640 | $87,400 |
Source: Public Records
Map
Nearby Homes
- 1533 Lenora Dr
- 522 Pearl St
- 528 Pearl St
- 200 Oregon Terrace
- 312 N Barneburg Rd
- 1503 E Main St
- 1925 Stratford Ave
- 514 Marie St
- 1560 Cambridge Cir
- 1711 E Main St
- 313 Marie St
- 1111 Stevens St Unit 1
- 1221 Skeeters Ln
- 1016 Queen Anne Ave
- 1008 Queen Anne Ave
- 204 Mount Echo Dr
- 302 Medford Heights Ln
- 214 Stark St
- 120 Stark St
- 120 Ashland Ave
- 409 N Keeneway Dr
- 409 N Keene Way Dr
- 1540 Stratford Ave
- 1533 Oregon Ave
- 1600 Stratford Ave
- 1540 Oregon Ave
- 333 N Keene Way Dr
- 1532 Stratford Ave
- 1532 Oregon Ave
- 1525 Oregon Ave
- 333 N Keeneway Dr
- 1609 Oregon Ave
- 1524 Oregon Ave
- 1524 Stratford Ave
- 340 N Keene Way Dr
- 500 N Keeneway Dr
- 1608 Stratford Ave
- 540 N Keene Way Dr
- 1533 Stratford Ave
- 1517 Oregon Ave