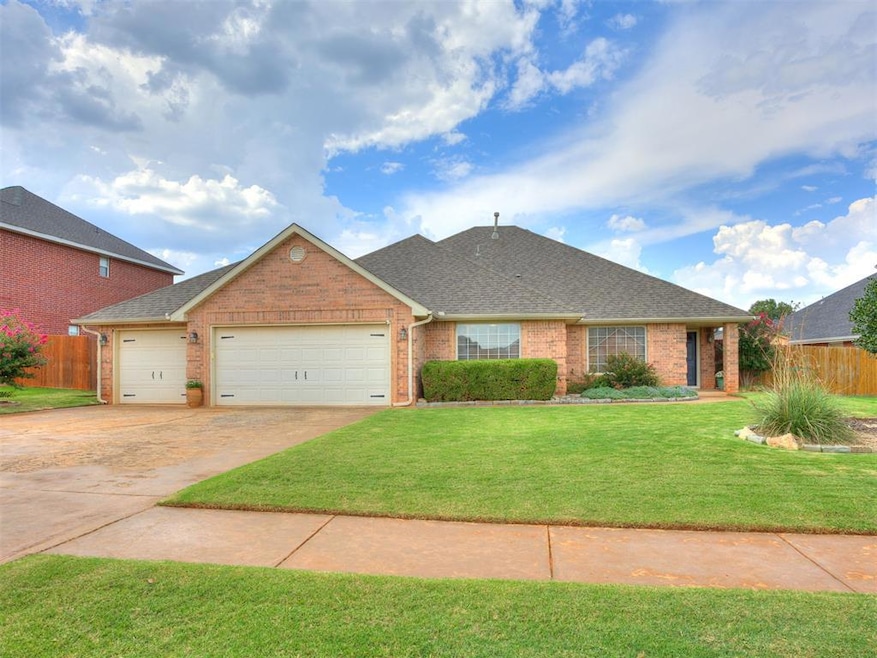

401 N Topaz Way Mustang, OK 73064
Estimated payment $1,825/month
Highlights
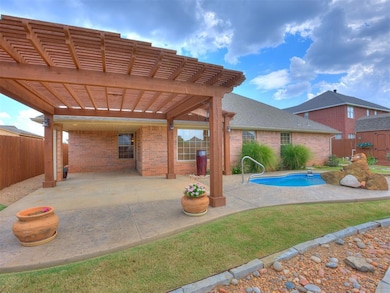
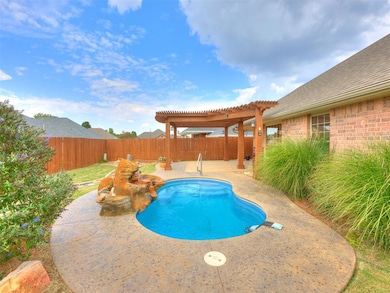
- Outdoor Pool
- Traditional Architecture
- Breakfast Area or Nook
- Mustang Lakehoma Elementary School Rated A-
- Covered Patio or Porch
- 3 Car Attached Garage
About This Home
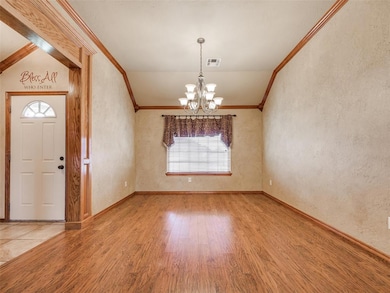
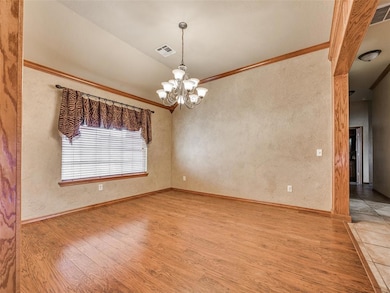
Beautifully Maintained One-Owner Home in Berkley Estates! Welcome to this charming and well-cared-for 3-bedroom, 2-bathroom home located in the desirable Berkeley Estates community. This one-owner home has been thoughtfully maintained and is move-in ready! The primary suite features a walk-in closet and double vanity, offering comfort and functionality. The open-concept layout connects the living room, kitchen, breakfast nook, and formal dining, creating a spacious and welcoming environment for entertaining or everyday living. Step outside to your own backyard oasis, complete with a small soaker pool, beautiful landscaping, and a cozy pergola—perfect for relaxing evenings or weekend gatherings. Additional features include a storm shelter, sprinkler system, and a new hot water heater for added peace of mind.
Home Details
Home Type
- Single Family
Est. Annual Taxes
- $2,182
Year Built
- Built in 2001
Lot Details
- 9,622 Sq Ft Lot
- Interior Lot
Parking
- 3 Car Attached Garage
Home Design
- Traditional Architecture
- Brick Frame
- Composition Roof
Interior Spaces
- 1,957 Sq Ft Home
- 1-Story Property
- Gas Log Fireplace
Kitchen
- Breakfast Area or Nook
- Gas Range
- Free-Standing Range
- Microwave
- Dishwasher
- Disposal
Bedrooms and Bathrooms
- 3 Bedrooms
- 2 Full Bathrooms
Pool
- Outdoor Pool
- Saltwater Pool
- Waterfall Pool Feature
Outdoor Features
- Covered Patio or Porch
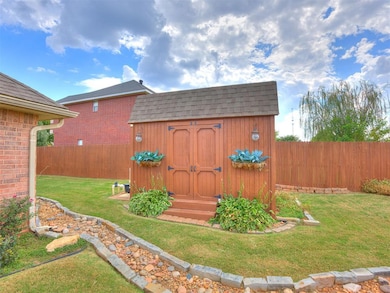
- Outbuilding
- Rain Gutters
Schools
- Mustang Lakehoma Elementary School
- Mustang Middle School
- Mustang High School
Utilities
- Central Heating and Cooling System
Listing and Financial Details
- Legal Lot and Block 5 / 10
Map
Home Values in the Area
Average Home Value in this Area
Tax History
| Year | Tax Paid | Tax Assessment Tax Assessment Total Assessment is a certain percentage of the fair market value that is determined by local assessors to be the total taxable value of land and additions on the property. | Land | Improvement |
|---|---|---|---|---|
| 2024 | $2,182 | $23,553 | $2,619 | $20,934 |
| 2023 | $2,182 | $22,867 | $2,400 | $20,467 |
| 2022 | $2,141 | $22,201 | $2,400 | $19,801 |
| 2021 | $2,173 | $22,435 | $2,400 | $20,035 |
| 2020 | $2,181 | $22,384 | $2,400 | $19,984 |
| 2019 | $2,115 | $21,732 | $2,400 | $19,332 |
| 2018 | $2,158 | $21,705 | $2,400 | $19,305 |
| 2017 | $2,089 | $21,270 | $2,400 | $18,870 |
| 2016 | $2,050 | $21,468 | $2,400 | $19,068 |
| 2015 | $2,026 | $20,249 | $2,400 | $17,849 |
| 2014 | $2,026 | $20,512 | $2,400 | $18,112 |
Property History
| Date | Event | Price | List to Sale | Price per Sq Ft |
|---|---|---|---|---|
| 11/04/2025 11/04/25 | Price Changed | $311,000 | -1.3% | $159 / Sq Ft |
| 10/05/2025 10/05/25 | Price Changed | $315,000 | -3.1% | $161 / Sq Ft |
| 09/18/2025 09/18/25 | For Sale | $325,000 | -- | $166 / Sq Ft |
Purchase History
| Date | Type | Sale Price | Title Company |
|---|---|---|---|
| Warranty Deed | $109,500 | None Available | |
| Warranty Deed | -- | -- | |
| Warranty Deed | $140,500 | -- | |
| Warranty Deed | $131,500 | -- | |
| Warranty Deed | $18,500 | -- | |
| Warranty Deed | -- | -- | |
| Warranty Deed | $20,500 | -- | |
| Warranty Deed | -- | -- |
Mortgage History
| Date | Status | Loan Amount | Loan Type |
|---|---|---|---|
| Open | $21,900 | No Value Available | |
| Previous Owner | $133,450 | No Value Available |
Source: MLSOK
MLS Number: 1192020
APN: 090096378
Disclaimer: Certain information contained herein is derived from information provided by parties other than Homes.com. All information provided is deemed reliable, but is not guaranteed to be accurate and should be independently verified.
![]() IDX information is provided exclusively for personal, non-commercial use, and may not be used for any purpose other than to identify prospective properties consumers may be interested in purchasing.
IDX information is provided exclusively for personal, non-commercial use, and may not be used for any purpose other than to identify prospective properties consumers may be interested in purchasing.
Information is deemed reliable but not guaranteed.
This information is not verified for authenticity or accuracy, is not guaranteed and may not reflect all real estate activity in the market.
Copyright 2025 MLSOK, Inc. All rights reserved.
- 320 N Jasper Way
- 313 N Shannon Way
- 101 N Shannon Way
- 913 N Centennial Way
- 4408 Moonlight Rd
- 4213 Moonlight Rd
- 608 N White Tail Way
- 1316 W Harvard Way
- 612 N White Tail Way
- 1308 W Harvard Way
- 716 N Cottontail Way
- 1425 W Harvard Way
- 1401 W Harvard Way
- 708 N White Tail Way
- 4716 Bermuda Dr
- 4601 Mustang Park Blvd
- 4712 Bermuda Dr
- 708 N Buckhorn Way
- 2001 W Crossbow Way
- 1924 W Flintlock Way
- 4413 Palmetto Bluff Dr
- 1135 W Johnathan Way
- 2008 W Flintlock Way
- 2020 W Flintlock Way
- 1112 N Pheasant Way
- 1004 N Donald Way
- 566 W Alamo Court Way
- 532 W Shadow Ridge Way
- 733 W Perry Dr
- 3633 Pete St
- 101 Fieldstone Way
- 4004 Becky Ln
- 3433 Little Creek Dr
- 4017 Olivia St
- 4001 Olivia St
- 320 E Georgia Terrace
- 360 N Pebble Creek Terrace
- 4221 Moonlight Rd
- 4301 Montage Blvd
- 605 E Juniper Ln
