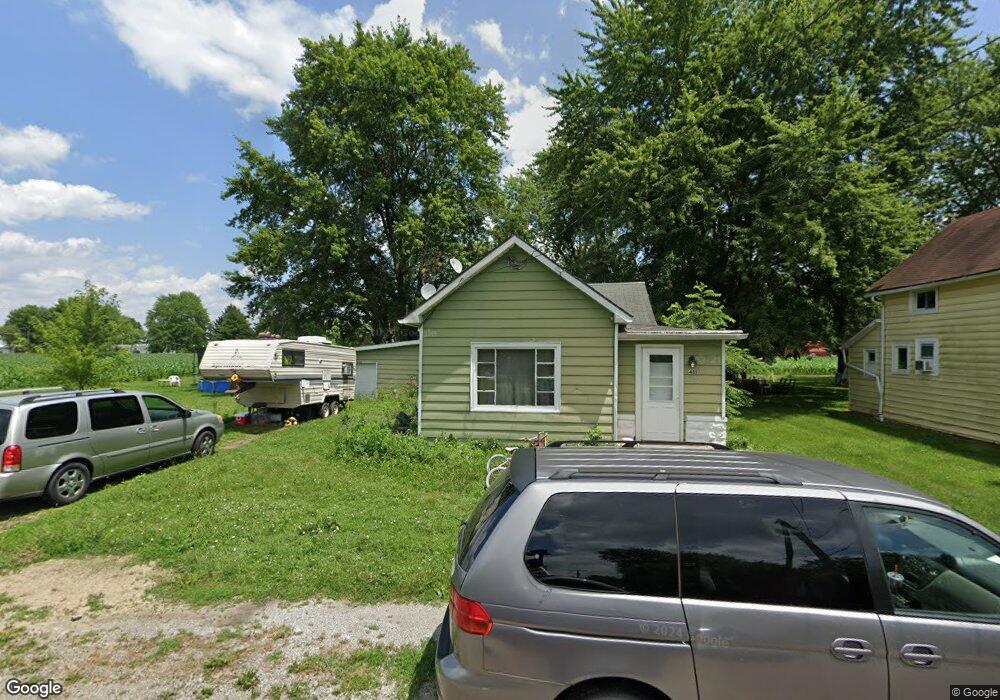
401 N Walnut St Middle Point, OH 45863
Estimated Value: $75,311 - $118,000
3
Beds
2
Baths
1,120
Sq Ft
$86/Sq Ft
Est. Value
About This Home
This home is located at 401 N Walnut St, Middle Point, OH 45863 and is currently estimated at $96,078, approximately $85 per square foot. 401 N Walnut St is a home with nearby schools including Lincolnview Elementary School and Lincolnview Junior/Senior High School.
Ownership History
Date
Name
Owned For
Owner Type
Purchase Details
Closed on
Oct 7, 2022
Sold by
Rode Alexandria Nicole
Bought by
Edwards Michael B and Edwards Tammy J
Current Estimated Value
Purchase Details
Closed on
Jul 21, 2020
Sold by
Lippi Sheridan M and Lippi Samantha J
Bought by
Rode Alexandria Nicole
Home Financials for this Owner
Home Financials are based on the most recent Mortgage that was taken out on this home.
Original Mortgage
$14,000
Interest Rate
3.2%
Mortgage Type
New Conventional
Purchase Details
Closed on
Oct 30, 2010
Bought by
Steen Mary J
Purchase Details
Closed on
Jan 9, 2006
Sold by
Steen Mary J and Meyer Mary J
Bought by
Lippi Sheridan M and Lippi Samantha J
Home Financials for this Owner
Home Financials are based on the most recent Mortgage that was taken out on this home.
Original Mortgage
$51,688
Interest Rate
6.42%
Mortgage Type
FHA
Purchase Details
Closed on
Jan 11, 2001
Bought by
Lippi Sheridan M and Lippi Samanth
Create a Home Valuation Report for This Property
The Home Valuation Report is an in-depth analysis detailing your home's value as well as a comparison with similar homes in the area
Home Values in the Area
Average Home Value in this Area
Purchase History
| Date | Buyer | Sale Price | Title Company |
|---|---|---|---|
| Edwards Michael B | $13,000 | -- | |
| Rode Alexandria Nicole | $34,800 | None Available | |
| Steen Mary J | $35,000 | -- | |
| Lippi Sheridan M | $52,500 | None Available | |
| Lippi Sheridan M | $52,500 | -- | |
| Lippi Sheridan M | $52,500 | -- |
Source: Public Records
Mortgage History
| Date | Status | Borrower | Loan Amount |
|---|---|---|---|
| Previous Owner | Rode Alexandria Nicole | $14,000 | |
| Previous Owner | Lippi Sheridan M | $51,688 |
Source: Public Records
Tax History Compared to Growth
Tax History
| Year | Tax Paid | Tax Assessment Tax Assessment Total Assessment is a certain percentage of the fair market value that is determined by local assessors to be the total taxable value of land and additions on the property. | Land | Improvement |
|---|---|---|---|---|
| 2024 | $585 | $16,680 | $1,410 | $15,270 |
| 2023 | $585 | $16,680 | $1,410 | $15,270 |
| 2022 | $603 | $12,680 | $1,300 | $11,380 |
| 2021 | $606 | $12,680 | $1,300 | $11,380 |
| 2020 | $604 | $12,680 | $1,300 | $11,380 |
| 2019 | $496 | $10,870 | $1,300 | $9,570 |
| 2018 | $475 | $10,870 | $1,300 | $9,570 |
| 2017 | $444 | $10,870 | $1,300 | $9,570 |
| 2016 | $378 | $10,370 | $1,300 | $9,070 |
| 2015 | $373 | $10,370 | $1,300 | $9,070 |
| 2014 | $386 | $10,370 | $1,300 | $9,070 |
| 2013 | $455 | $10,370 | $1,300 | $9,070 |
Source: Public Records
Map
Nearby Homes
- 104 W Railroad St
- 112 W Railroad St
- 104 W South St
- TBD Dog Creek Rd
- 8951 Brickner Rd
- 11630 Clearview Dr
- 19083 Venedocia Eastern Rd
- 18906 Bebb St
- 15044 Main St
- 19059 Wittington St
- 616 W 5th St
- 604 W 6th St
- 409 N Bredeick St
- 503 W 6th St
- 606 S Cass St
- 634 S Clay St
- 424 S Canal St
- 14162 Overholt Rd
- 221 S Main St
- 7510 State Route 66