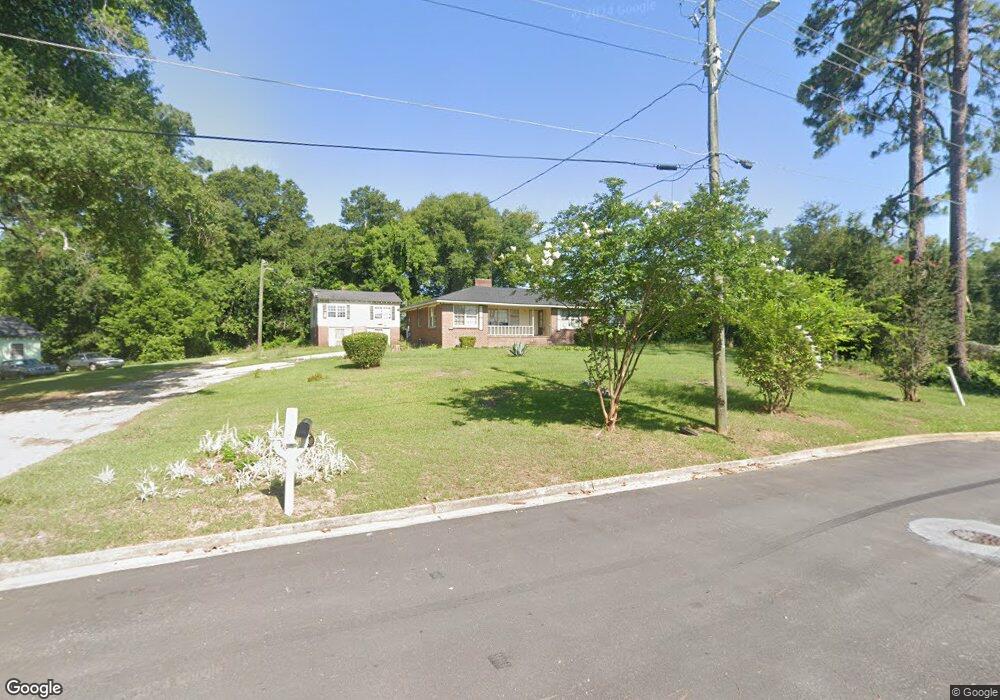
401 Nona Dr Albany, GA 31705
Estimated Value: $82,000 - $104,000
3
Beds
2
Baths
1,787
Sq Ft
$53/Sq Ft
Est. Value
About This Home
This home is located at 401 Nona Dr, Albany, GA 31705 and is currently estimated at $94,710, approximately $52 per square foot. 401 Nona Dr is a home located in Dougherty County with nearby schools including Robert H. Harvey Elementary School, Albany Middle School, and Radium Springs Middle School.
Ownership History
Date
Name
Owned For
Owner Type
Purchase Details
Closed on
Jan 7, 2022
Sold by
Bailey Wilburn Dean
Bought by
Johnson Darrick
Current Estimated Value
Home Financials for this Owner
Home Financials are based on the most recent Mortgage that was taken out on this home.
Original Mortgage
$53,356
Outstanding Balance
$15,048
Interest Rate
3.11%
Mortgage Type
Mortgage Modification
Estimated Equity
$79,662
Purchase Details
Closed on
Nov 1, 2011
Sold by
Sizemore W James
Bought by
Bailey Wilburn Dean and Bailey Felicha Ann
Purchase Details
Closed on
Mar 8, 2000
Sold by
Sizemore Bros Properties
Bought by
Sizemore W James
Purchase Details
Closed on
Dec 31, 1996
Sold by
Sizemore Wm James and Johnnie Sue
Bought by
Sizemore Bros Properties:Sizemore W Jame
Purchase Details
Closed on
Mar 17, 1981
Sold by
Allen Mary G
Bought by
Sizemore Wm J and Sizemore Sue
Create a Home Valuation Report for This Property
The Home Valuation Report is an in-depth analysis detailing your home's value as well as a comparison with similar homes in the area
Home Values in the Area
Average Home Value in this Area
Purchase History
| Date | Buyer | Sale Price | Title Company |
|---|---|---|---|
| Johnson Darrick | $70,000 | -- | |
| Johnson Darrick | $70,000 | -- | |
| Bailey Wilburn Dean | $78,000 | -- | |
| Sizemore W James | -- | -- | |
| Sizemore Bros Properties:Sizemore W Jame | $100,000 | -- | |
| Sizemore Wm J | $90,000 | -- |
Source: Public Records
Mortgage History
| Date | Status | Borrower | Loan Amount |
|---|---|---|---|
| Open | Johnson Darrick | $53,356 |
Source: Public Records
Tax History Compared to Growth
Tax History
| Year | Tax Paid | Tax Assessment Tax Assessment Total Assessment is a certain percentage of the fair market value that is determined by local assessors to be the total taxable value of land and additions on the property. | Land | Improvement |
|---|---|---|---|---|
| 2024 | $1,336 | $28,000 | $1,800 | $26,200 |
| 2023 | $1,305 | $28,000 | $1,800 | $26,200 |
| 2022 | $1,216 | $28,000 | $1,800 | $26,200 |
| 2021 | $1,127 | $28,000 | $1,800 | $26,200 |
| 2020 | $1,130 | $28,000 | $1,800 | $26,200 |
| 2019 | $1,134 | $28,000 | $1,800 | $26,200 |
| 2018 | $1,139 | $28,000 | $1,800 | $26,200 |
| 2017 | $1,061 | $28,000 | $1,800 | $26,200 |
| 2016 | $1,062 | $28,000 | $1,800 | $26,200 |
| 2015 | $1,064 | $28,000 | $1,800 | $26,200 |
| 2014 | $1,051 | $28,000 | $1,800 | $26,200 |
Source: Public Records
Map
Nearby Homes
- 1408 E Mercer Ave
- 608 Cason St
- 1411 E Gordon Ave
- 210 S Carroll St
- 1400 E Lincoln Ave
- 1401 E Waddell Ave
- 1521 E Broad Ave
- 211 Collins St
- 811 S Maple St
- 205 Collins St
- 1418 E Roosevelt Ave
- 1410 E Roosevelt Ave
- 1318 E Roosevelt Ave
- 1219 Bonnyview Ave
- 2004 Keystone Ave
- 2006 Keystone Ave
- 1323 E Society Ave
- 1017 E Roosevelt Ave
- 307 Acorn St
- 309 Acorn St