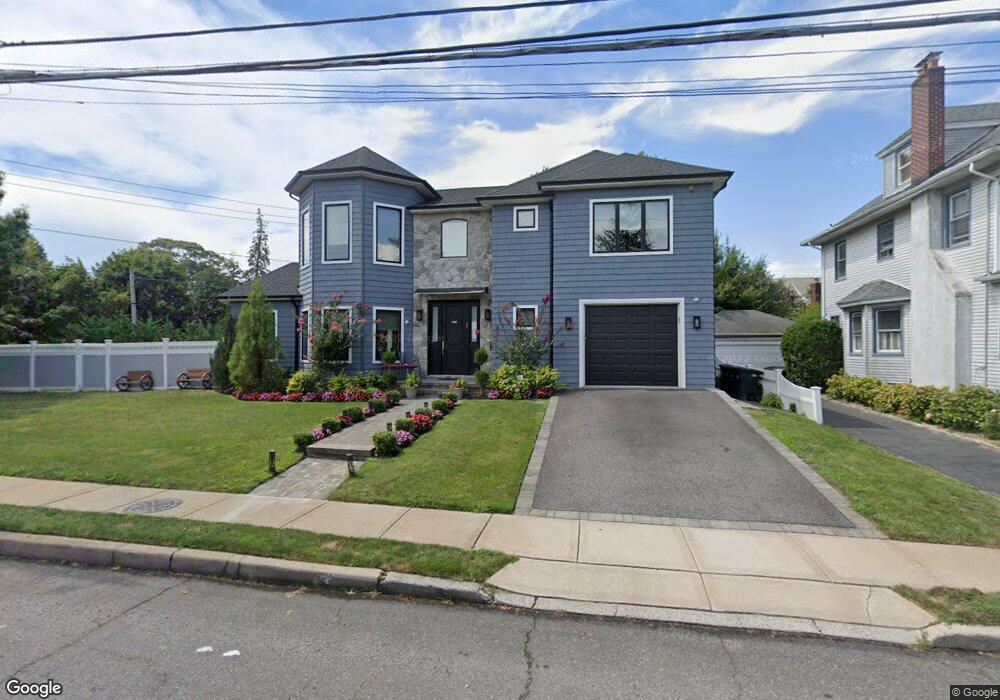
401 Oceanpoint Ave Cedarhurst, NY 11516
Estimated Value: $1,967,710 - $2,464,000
7
Beds
5
Baths
3,738
Sq Ft
$593/Sq Ft
Est. Value
About This Home
This home is located at 401 Oceanpoint Ave, Cedarhurst, NY 11516 and is currently estimated at $2,215,855, approximately $592 per square foot. 401 Oceanpoint Ave is a home located in Nassau County with nearby schools including Lawrence Primary School, Lawrence Elementary School, and Lawrence Middle School.
Ownership History
Date
Name
Owned For
Owner Type
Purchase Details
Closed on
Sep 27, 2017
Sold by
Oceanpoint Partners Llc
Bought by
Sabo Allen and Sabo Debbie
Current Estimated Value
Home Financials for this Owner
Home Financials are based on the most recent Mortgage that was taken out on this home.
Original Mortgage
$400,000
Outstanding Balance
$334,113
Interest Rate
3.82%
Mortgage Type
New Conventional
Estimated Equity
$1,881,742
Purchase Details
Closed on
Sep 17, 2015
Sold by
Tornheim Joseph
Bought by
Oceanpoint Partners Llc
Purchase Details
Closed on
Mar 5, 2014
Sold by
Tornheim Joseph
Bought by
Tornheim Joseph
Purchase Details
Closed on
Mar 31, 1999
Purchase Details
Closed on
Jul 31, 1996
Sold by
Goldstein Helen
Bought by
Tornheim Peter and Tornheim Joseph
Home Financials for this Owner
Home Financials are based on the most recent Mortgage that was taken out on this home.
Original Mortgage
$161,500
Interest Rate
8.08%
Mortgage Type
Purchase Money Mortgage
Create a Home Valuation Report for This Property
The Home Valuation Report is an in-depth analysis detailing your home's value as well as a comparison with similar homes in the area
Home Values in the Area
Average Home Value in this Area
Purchase History
| Date | Buyer | Sale Price | Title Company |
|---|---|---|---|
| Sabo Allen | $999,000 | None Available | |
| Oceanpoint Partners Llc | $500,000 | The Judicial Title Insurance | |
| Tornheim Joseph | $300,000 | -- | |
| -- | $82,000 | -- | |
| Tornheim Peter | $170,000 | -- |
Source: Public Records
Mortgage History
| Date | Status | Borrower | Loan Amount |
|---|---|---|---|
| Open | Sabo Allen | $400,000 | |
| Previous Owner | Tornheim Peter | $161,500 |
Source: Public Records
Tax History Compared to Growth
Tax History
| Year | Tax Paid | Tax Assessment Tax Assessment Total Assessment is a certain percentage of the fair market value that is determined by local assessors to be the total taxable value of land and additions on the property. | Land | Improvement |
|---|---|---|---|---|
| 2025 | $14,794 | $1,061 | $286 | $775 |
| 2024 | $5,259 | $1,096 | $295 | $801 |
Source: Public Records
Map
Nearby Homes
- 422 Cedarhurst Ave
- 439 Bayview Ave
- 508 Monroe St
- 467 W Broadway
- 272 Cedarhurst Ave Unit A6
- 291 Cedarhurst Ave Unit K9
- 279 Cedarhurst Ave Unit G-6
- 461 5th Ave
- 523 Bayview Ave
- 347 Roselle Ave
- 544 Arlington Rd
- 463 Summit Ave Unit 2F
- 536 Albemarle Rd
- 7 Park Cir
- 366 Carvel Ave
- 548 Albemarle Rd
- 313 Forest Ave
- 410 Church Ave
- 559 Arlington Place
- 324 Buckingham Rd
- 526 W Broadway
- 405 Oceanpoint Ave
- 409 Oceanpoint Ave
- 400 Oceanpoint Ave
- 542 W Broadway
- 537 W Broadway
- 402 Oceanpoint Ave
- 404 Cedarhurst Ave
- 342 Cedarhurst Ave
- 408 Oceanpoint Ave
- 546 W Broadway
- 412 Oceanpoint Ave
- 417 Oceanpoint Ave
- 334 Cedarhurst Ave
- 416 Cedarhurst Ave
- 416 Oceanpoint Ave
- 528 Central Place
- 351 Cedarhurst Ave
- 545 W Broadway
- 423 Oceanpoint Ave