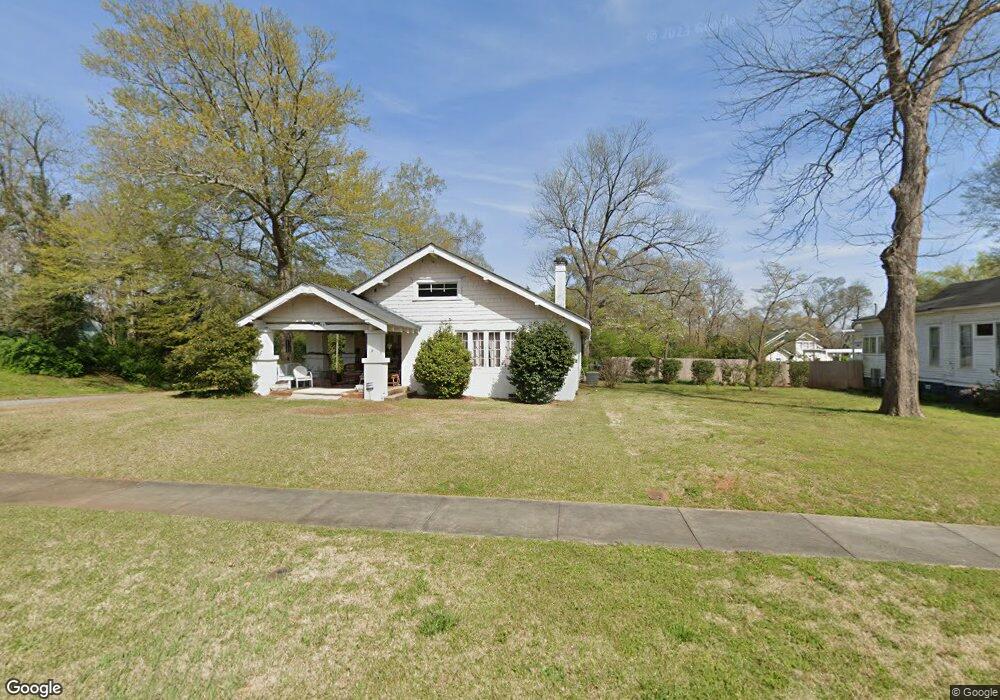
401 Park Ave Lagrange, GA 30240
Estimated Value: $178,912 - $199,000
3
Beds
1
Bath
1,571
Sq Ft
$119/Sq Ft
Est. Value
About This Home
This home is located at 401 Park Ave, Lagrange, GA 30240 and is currently estimated at $186,478, approximately $118 per square foot. 401 Park Ave is a home with nearby schools including Hollis Hand Elementary School, Ethel W. Kight Elementary School, and Franklin Forest Elementary School.
Ownership History
Date
Name
Owned For
Owner Type
Purchase Details
Closed on
Oct 14, 2005
Sold by
Brackett Michael L
Bought by
Treadwell Robin
Current Estimated Value
Home Financials for this Owner
Home Financials are based on the most recent Mortgage that was taken out on this home.
Original Mortgage
$95,501
Outstanding Balance
$50,014
Interest Rate
5.71%
Mortgage Type
FHA
Estimated Equity
$136,464
Purchase Details
Closed on
Sep 1, 1998
Sold by
Hurt Julie
Bought by
Michael L Brackett
Purchase Details
Closed on
Jun 5, 1995
Sold by
Woeler Susan
Bought by
Hurt Julie
Purchase Details
Closed on
Feb 11, 1993
Sold by
City Of Lagrange
Bought by
Woeler Susan
Purchase Details
Closed on
Feb 4, 1991
Sold by
Bryant Kathryn
Bought by
City Of Lagrange
Purchase Details
Closed on
Jun 21, 1983
Bought by
Bryant Kathryn
Purchase Details
Closed on
Jan 1, 1978
Create a Home Valuation Report for This Property
The Home Valuation Report is an in-depth analysis detailing your home's value as well as a comparison with similar homes in the area
Purchase History
| Date | Buyer | Sale Price | Title Company |
|---|---|---|---|
| Treadwell Robin | $97,000 | -- | |
| Michael L Brackett | $75,000 | -- | |
| Hurt Julie | $65,000 | -- | |
| Woeler Susan | -- | -- | |
| City Of Lagrange | $43,000 | -- | |
| Bryant Kathryn | -- | -- | |
| -- | -- | -- |
Source: Public Records
Mortgage History
| Date | Status | Borrower | Loan Amount |
|---|---|---|---|
| Open | Treadwell Robin | $95,501 |
Source: Public Records
Tax History
| Year | Tax Paid | Tax Assessment Tax Assessment Total Assessment is a certain percentage of the fair market value that is determined by local assessors to be the total taxable value of land and additions on the property. | Land | Improvement |
|---|---|---|---|---|
| 2025 | $1,575 | $62,360 | $10,000 | $52,360 |
| 2024 | $1,446 | $55,000 | $10,000 | $45,000 |
| 2023 | $1,479 | $56,200 | $10,000 | $46,200 |
| 2022 | $1,494 | $53,520 | $10,000 | $43,520 |
| 2021 | $1,466 | $48,600 | $10,000 | $38,600 |
| 2020 | $1,466 | $48,600 | $10,000 | $38,600 |
| 2019 | $817 | $27,080 | $4,800 | $22,280 |
| 2018 | $805 | $26,680 | $4,400 | $22,280 |
| 2017 | $805 | $26,680 | $4,400 | $22,280 |
| 2016 | $794 | $26,330 | $4,400 | $21,930 |
| 2015 | $808 | $26,749 | $4,819 | $21,930 |
| 2014 | $775 | $25,595 | $4,819 | $20,776 |
| 2013 | -- | $28,521 | $4,796 | $23,725 |
Source: Public Records
Map
Nearby Homes
- 304 Boulevard
- 403 College Ave
- 208 Boulevard
- 421 College Ave
- 207 Wilkes St
- 405 W Broome St Unit 2
- 405 W Broome St Unit 3
- 405 W Broome St Unit 4
- 405 W Broome St Unit 1
- 405 W Broome St Unit 5
- 600 Park Ave
- 505 S Lewis St
- 509 S Lewis St
- 217 Jefferson St
- TRACT 1 W Haralson St
- 206 Broad St
- 203 Waverly Way
- 0 N Lee St Unit 10550825
- 310 N Lee St
- 812 Elm St
Your Personal Tour Guide
Ask me questions while you tour the home.