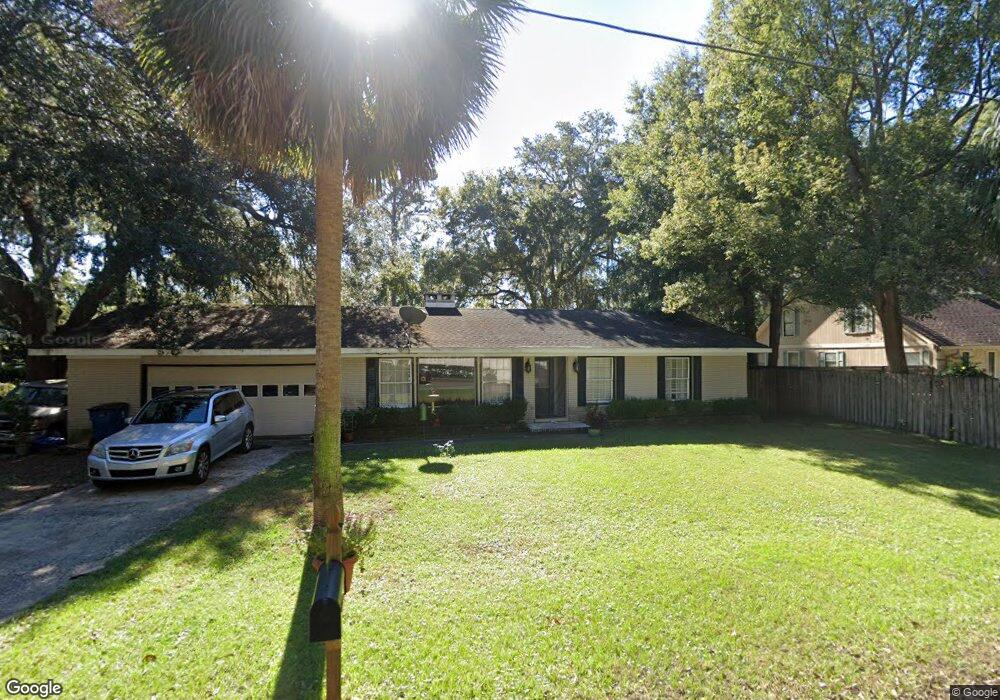
401 Pine St Saint Simons Island, GA 31522
Estimated Value: $532,128 - $542,000
3
Beds
2
Baths
1,900
Sq Ft
$283/Sq Ft
Est. Value
About This Home
This home is located at 401 Pine St, Saint Simons Island, GA 31522 and is currently estimated at $538,282, approximately $283 per square foot. 401 Pine St is a home located in Glynn County with nearby schools including Oglethorpe Point Elementary School, Glynn Middle School, and Glynn Academy.
Ownership History
Date
Name
Owned For
Owner Type
Purchase Details
Closed on
Sep 3, 2008
Sold by
Helfrich John R
Bought by
Helfrich John R and Helfrich Traci R
Current Estimated Value
Purchase Details
Closed on
May 15, 2006
Sold by
Hoard Stephen Barrett
Bought by
Helfrich John R
Home Financials for this Owner
Home Financials are based on the most recent Mortgage that was taken out on this home.
Original Mortgage
$228,000
Outstanding Balance
$132,123
Interest Rate
6.41%
Mortgage Type
New Conventional
Estimated Equity
$406,159
Purchase Details
Closed on
Oct 5, 2005
Sold by
Ray Condon Jeanne M
Bought by
Hoard Stephen Barrett
Create a Home Valuation Report for This Property
The Home Valuation Report is an in-depth analysis detailing your home's value as well as a comparison with similar homes in the area
Home Values in the Area
Average Home Value in this Area
Purchase History
| Date | Buyer | Sale Price | Title Company |
|---|---|---|---|
| Helfrich John R | -- | -- | |
| Helfrich John R | $285,000 | -- | |
| Hoard Stephen Barrett | $220,000 | -- |
Source: Public Records
Mortgage History
| Date | Status | Borrower | Loan Amount |
|---|---|---|---|
| Open | Helfrich John R | $228,000 | |
| Closed | Helfrich John R | $57,000 |
Source: Public Records
Tax History Compared to Growth
Tax History
| Year | Tax Paid | Tax Assessment Tax Assessment Total Assessment is a certain percentage of the fair market value that is determined by local assessors to be the total taxable value of land and additions on the property. | Land | Improvement |
|---|---|---|---|---|
| 2025 | $4,492 | $179,120 | $69,200 | $109,920 |
| 2024 | $4,302 | $171,520 | $66,320 | $105,200 |
| 2023 | $1,818 | $171,520 | $66,320 | $105,200 |
| 2022 | $2,243 | $145,240 | $66,320 | $78,920 |
| 2021 | $2,310 | $117,000 | $44,680 | $72,320 |
| 2020 | $2,329 | $114,400 | $44,680 | $69,720 |
| 2019 | $2,329 | $115,320 | $53,360 | $61,960 |
| 2018 | $2,514 | $115,320 | $53,360 | $61,960 |
| 2017 | $2,514 | $96,560 | $34,600 | $61,960 |
| 2016 | $2,332 | $96,560 | $34,600 | $61,960 |
| 2015 | $2,016 | $88,840 | $34,600 | $54,240 |
| 2014 | $2,016 | $83,080 | $28,840 | $54,240 |
Source: Public Records
Map
Nearby Homes
- 318 Palm St
- 315 Pine St
- 423 Palmetto St
- 123 Maple St
- 420 Holly St
- 287 Cedar St
- 701 3rd Ave
- 405 Magnolia St
- 116 Rosemont St
- 14 Atlantic Point
- 311 Dunbarton Dr
- 112 Rosemont St
- 702 Cedar St
- 17 Atlantic Point Dr
- 21 Atlantic Point Dr
- 112 Newfield St
- 134 Newfield St
- 215 Menendez Ave
- 121 Colonial Dr
- 121 Shore Rush Dr